Implement Autochartist’s renowned suite of trading tools easily. From technical analysis to sentiment insights, bring the best to your traders without the backend burdens.
Your Gateway to Premium Tools:
Experience a paradigm shift in how trading tools are integrated into broker platforms and enjoy the increased trader use and engagement of an all-in-one integration.
The Future of Brokerage Operations?
Discover the transformative power of the Autochartist Research Portal and lead your brokerage into a new era.
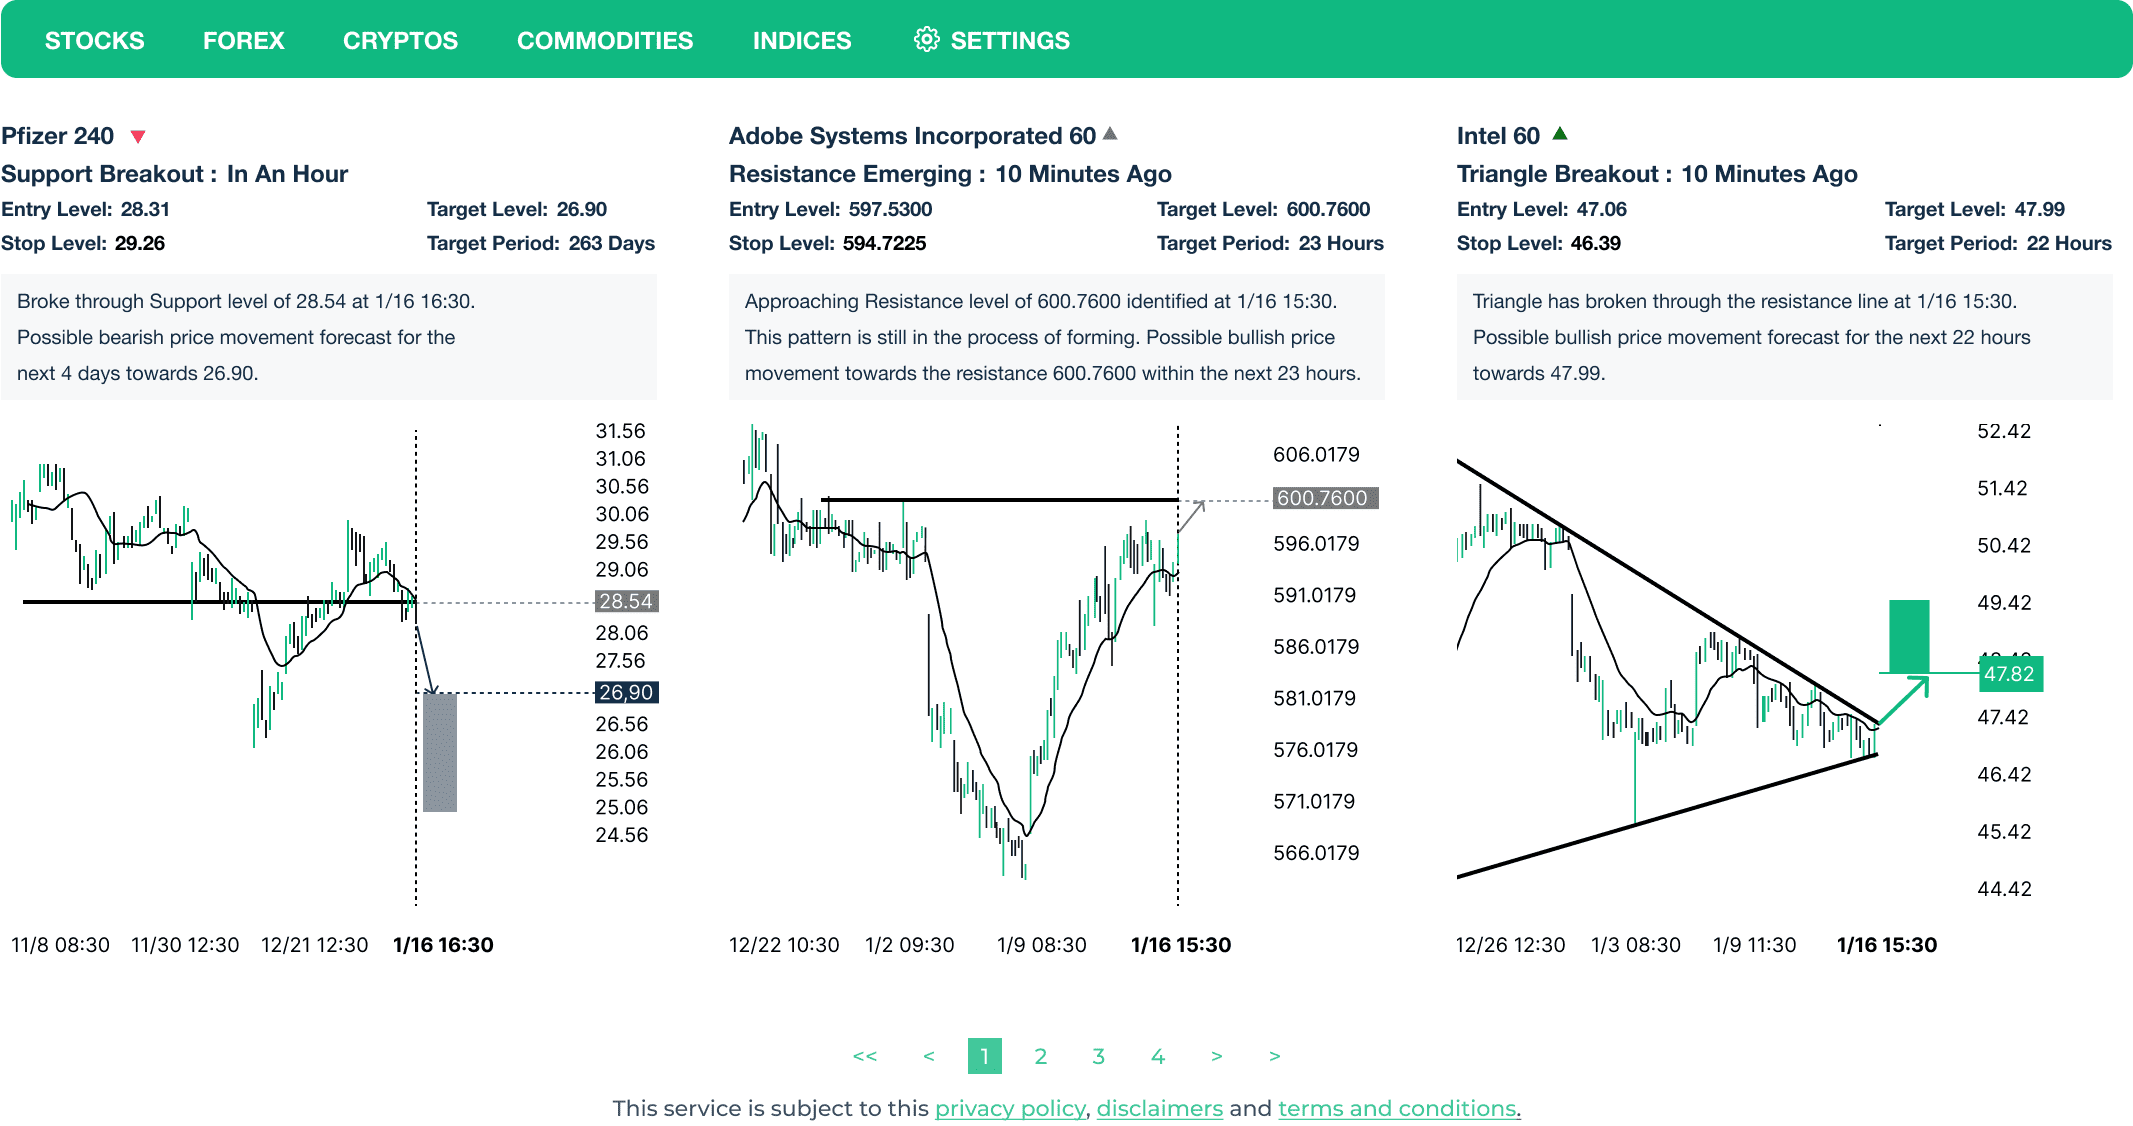
Research Portal:
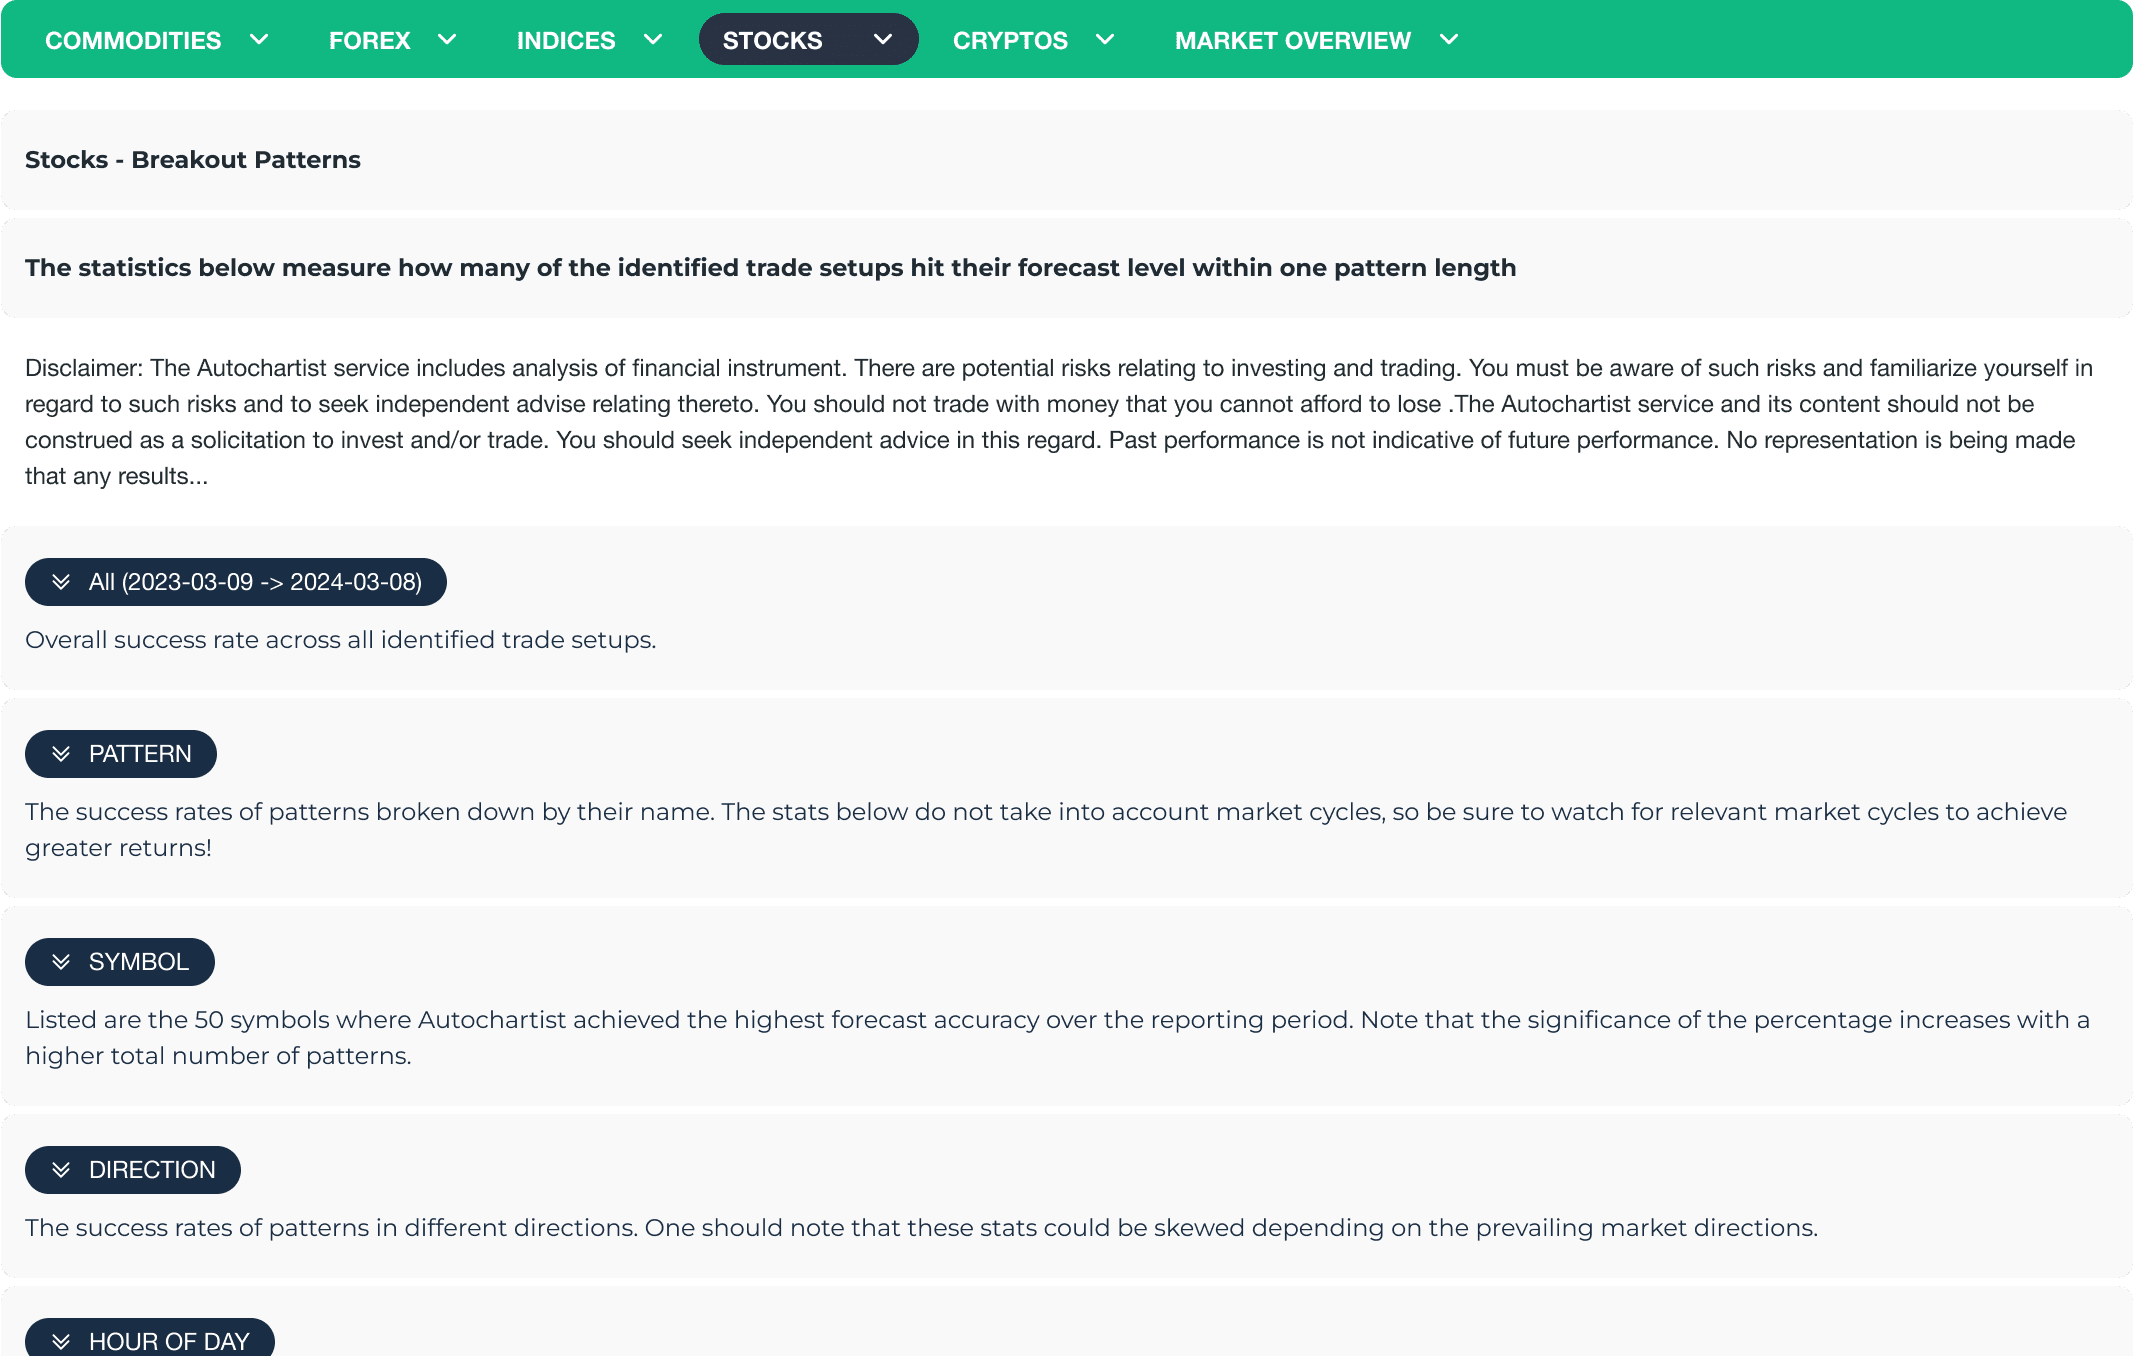
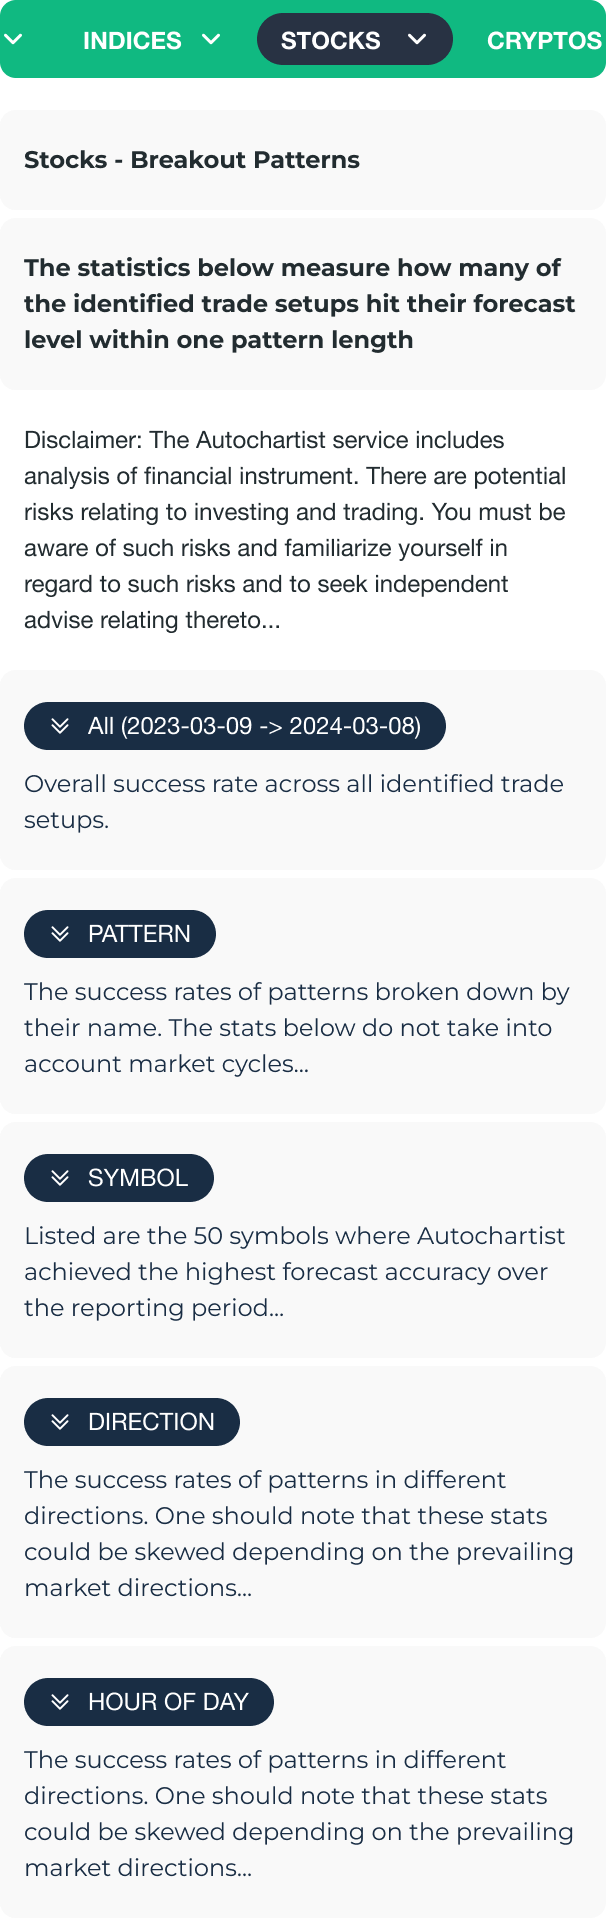
The statistics below summarize how often Autochartist’s forecasts reached their target levels. The stats are based on the last 12 months of analysis and are updated weekly. These statistics are independent of any stop-loss strategies and should be used only as an indication of trade-setup tendencies rather than as a complete trading system. Disclaimer: Past performance may not be indicative of future performance.
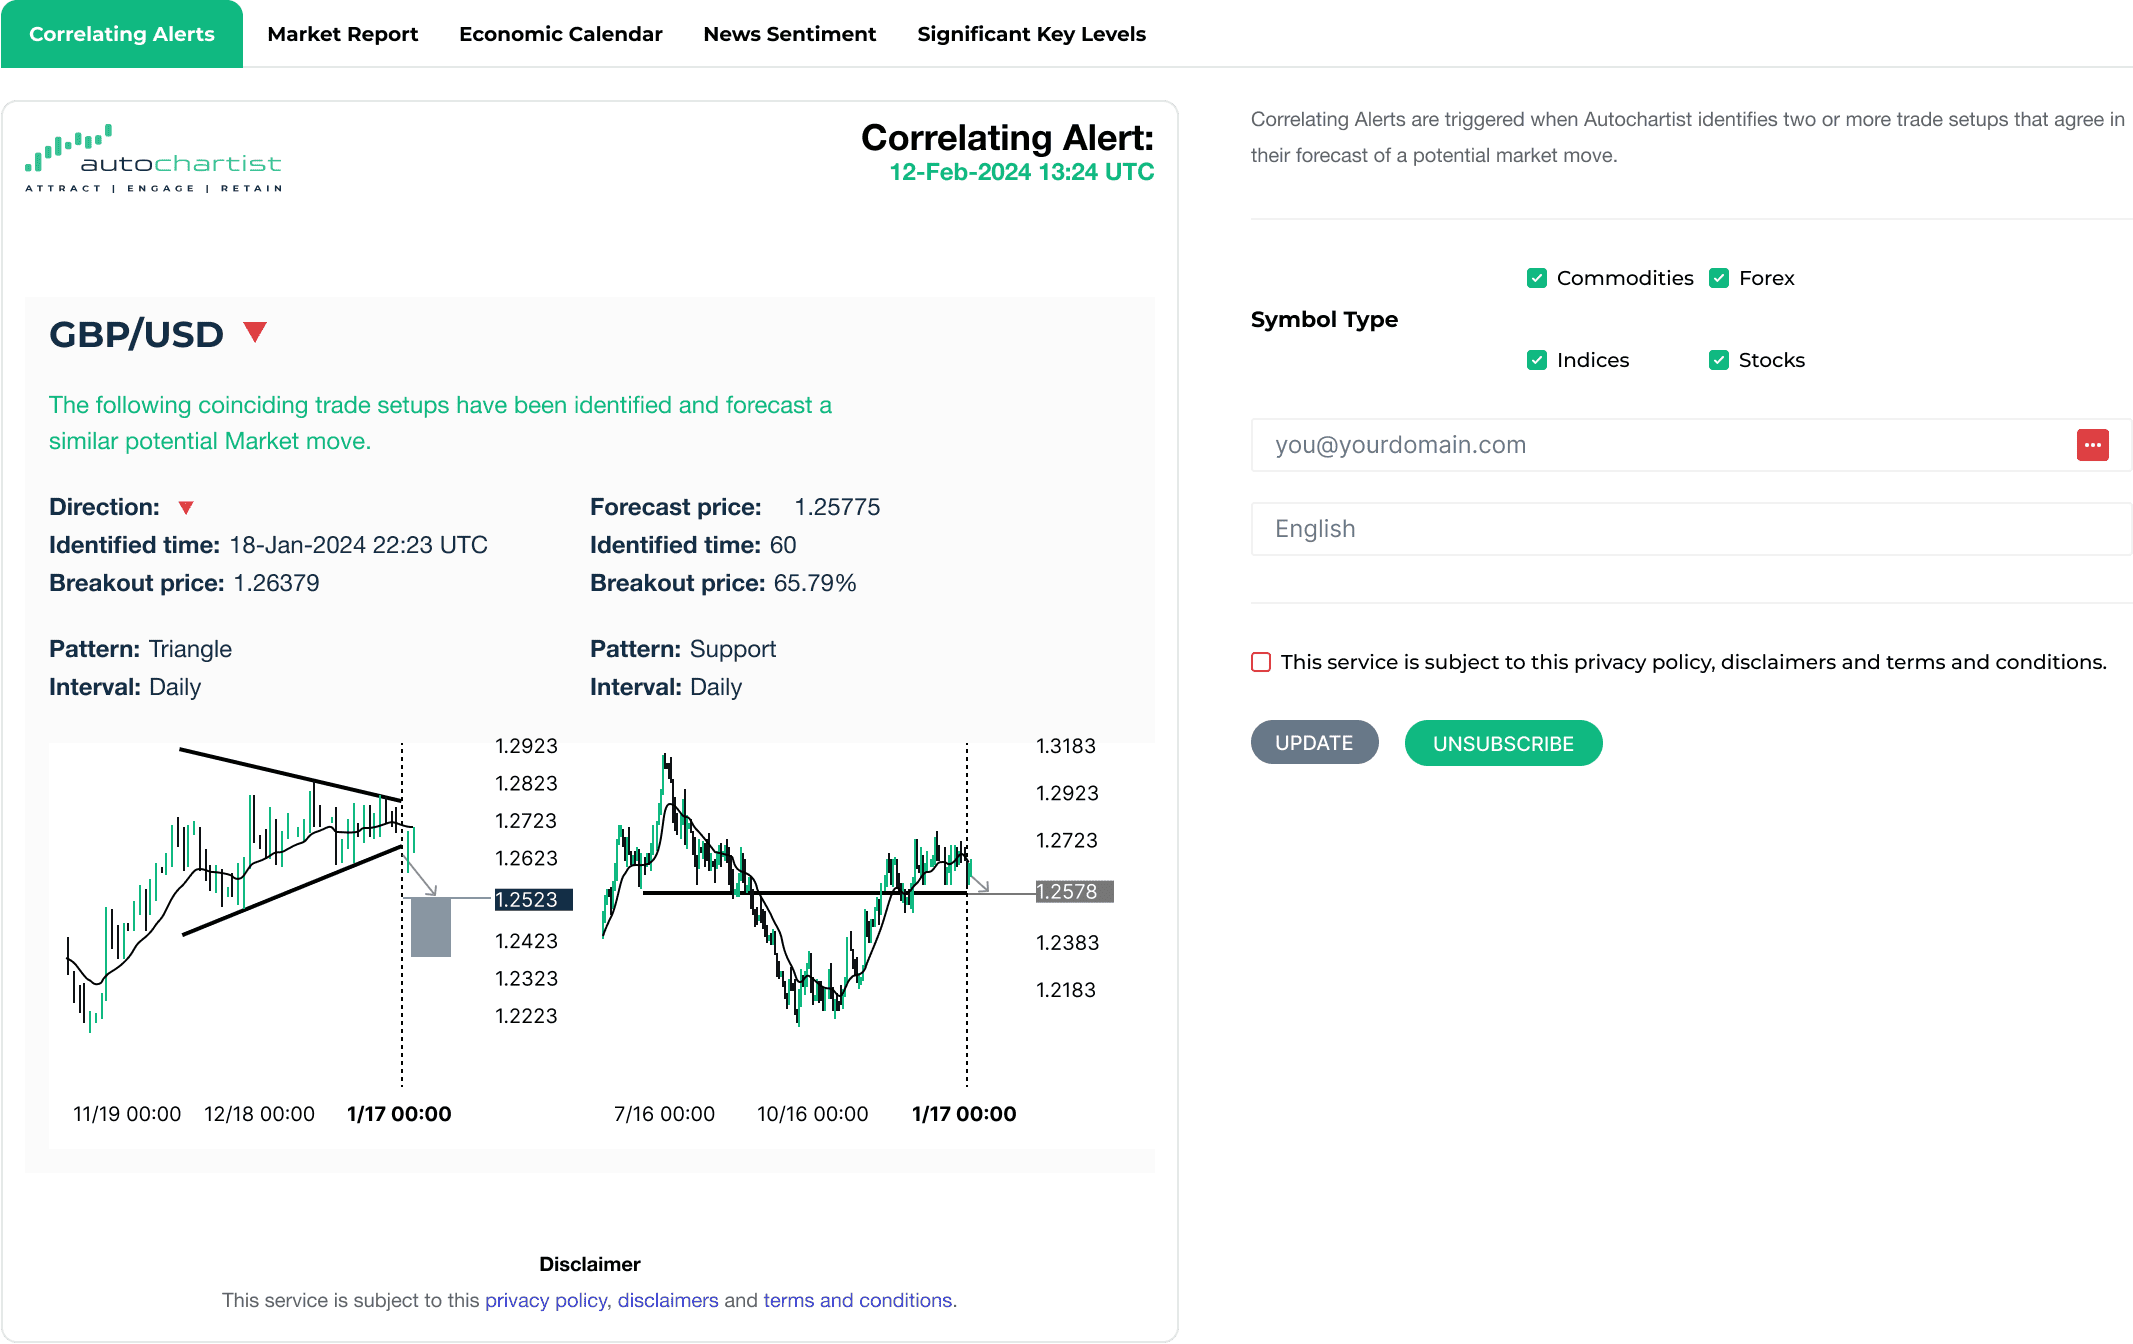
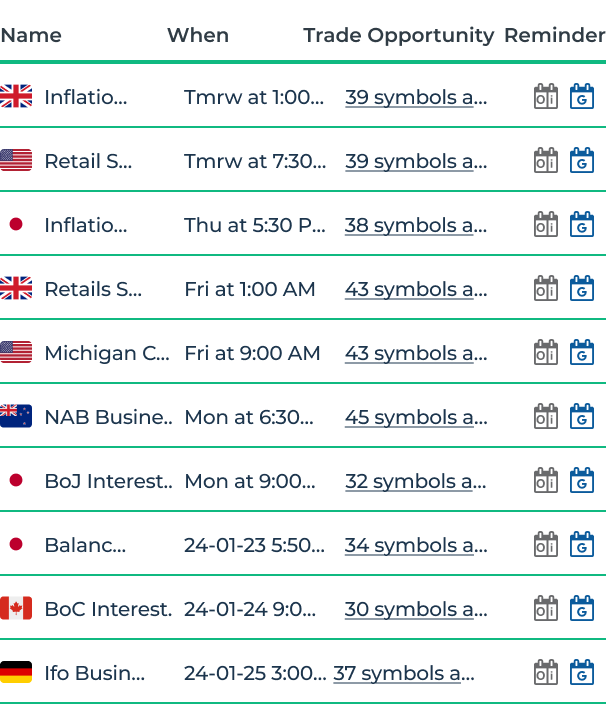
Take advantage of valuable market insights and trading opportunities via email and messaging. Sign up to receive the premium Autochartist emails of your choice – timely market event updates and actionable trade highlights delivered right to your inbox.
Take advantage of valuable market insights and trading opportunities via email and messaging. Sign up to receive the premium Autochartist emails of your choice – timely market event updates and actionable trade highlights delivered right to your inbox.
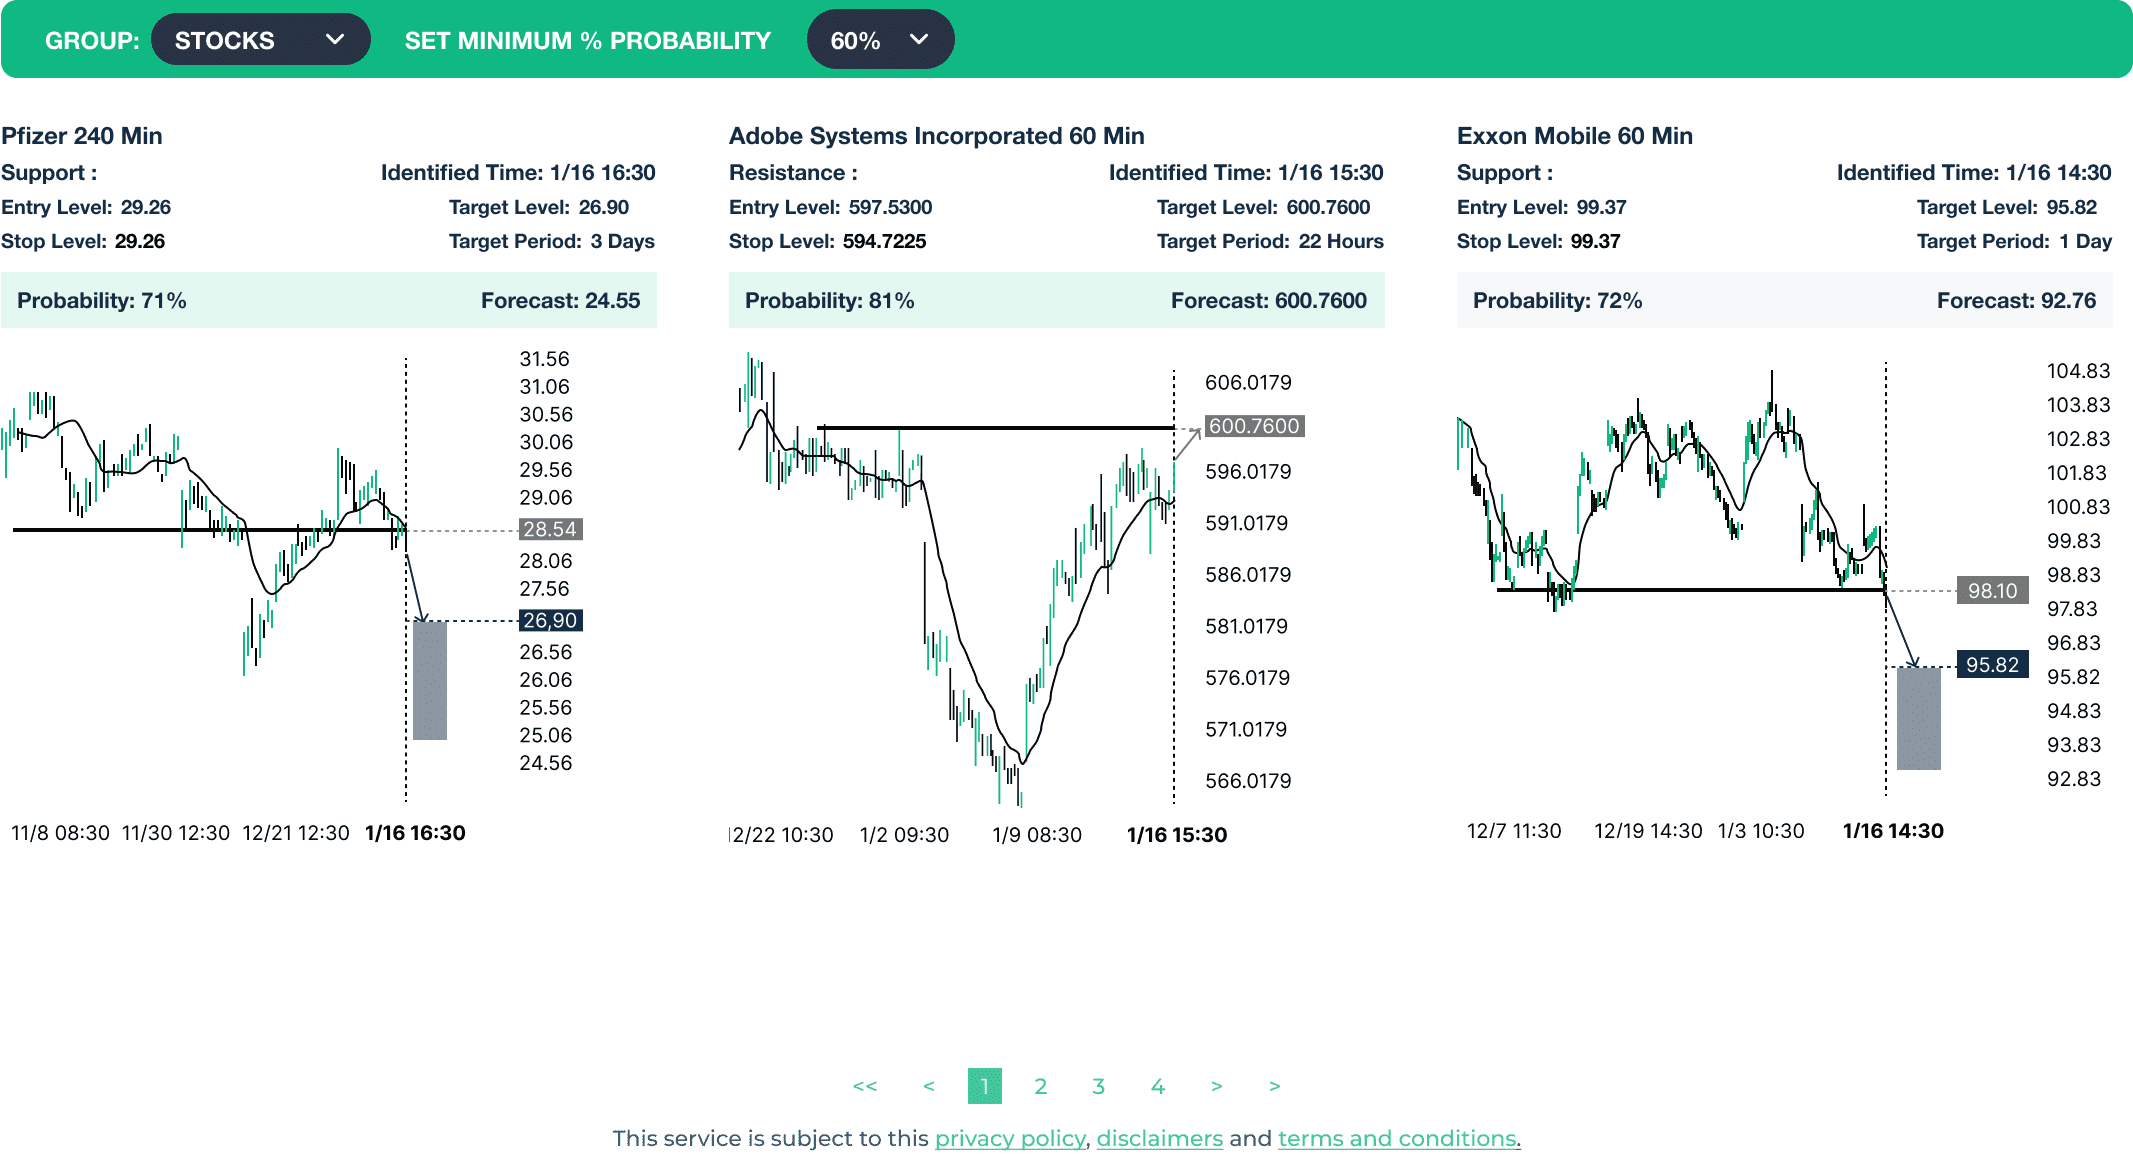
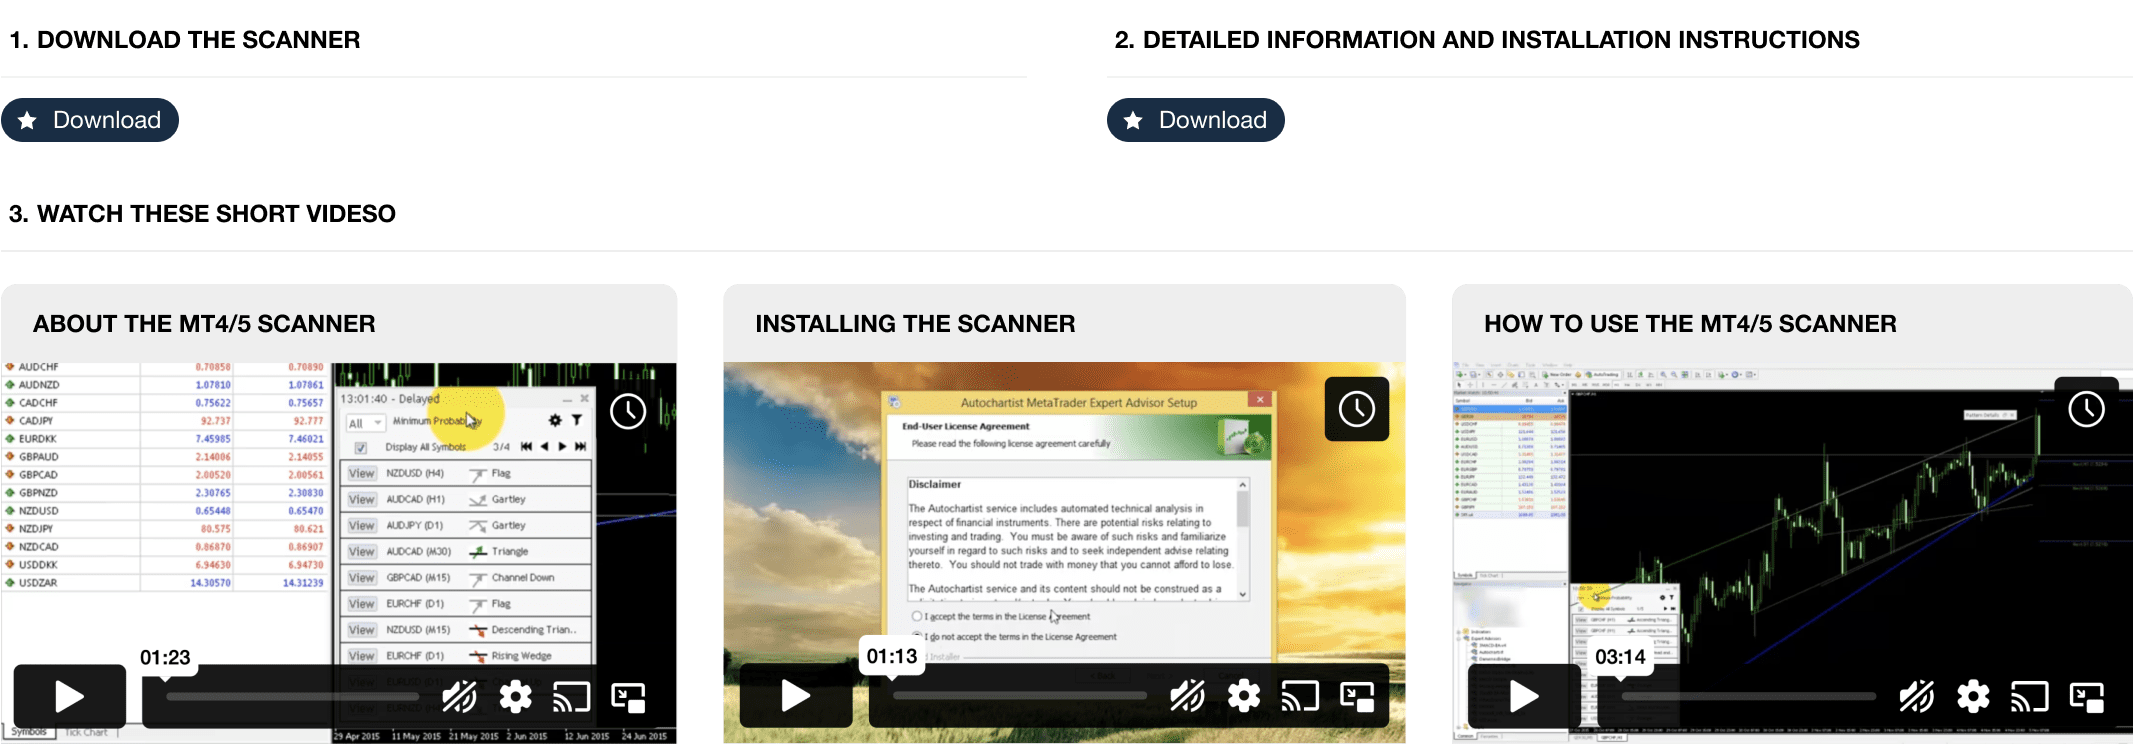
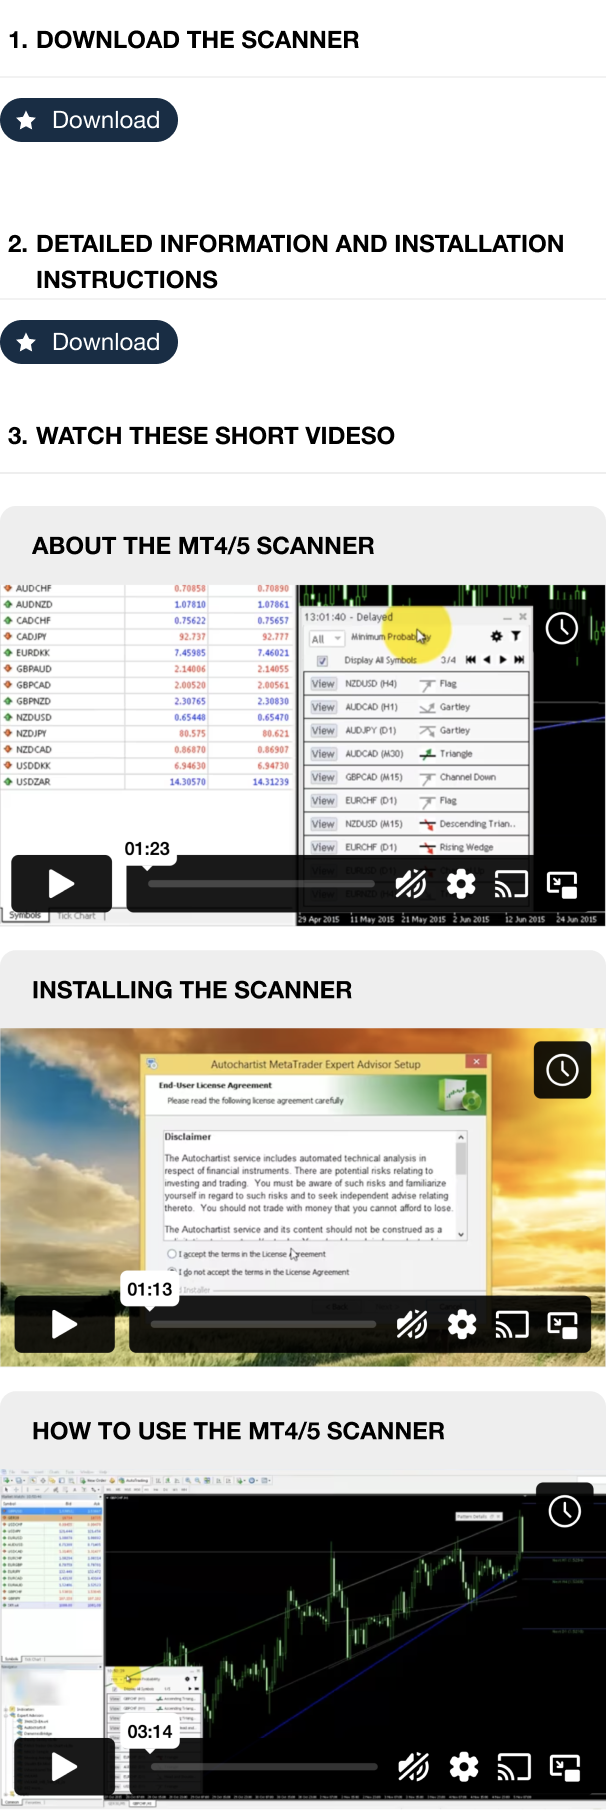
The MetaTrader Market Scanner plug-in for MetaTrader 4/5 scans the markets for trading opportunities for the symbols in your watch list across all time periods. It provides filters for fine-tuning searches and historical performance analysis for optimising trading strategies.
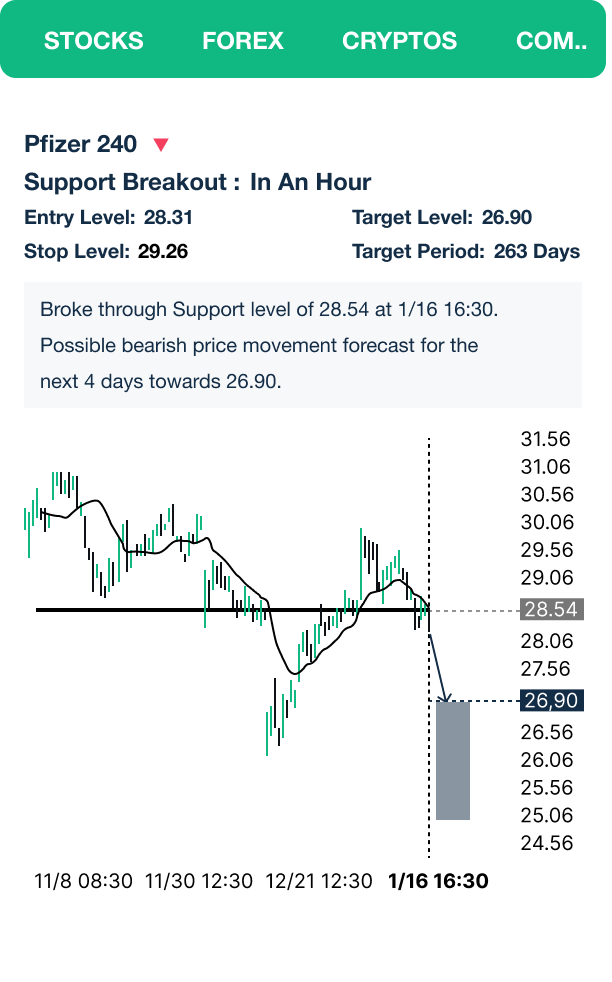
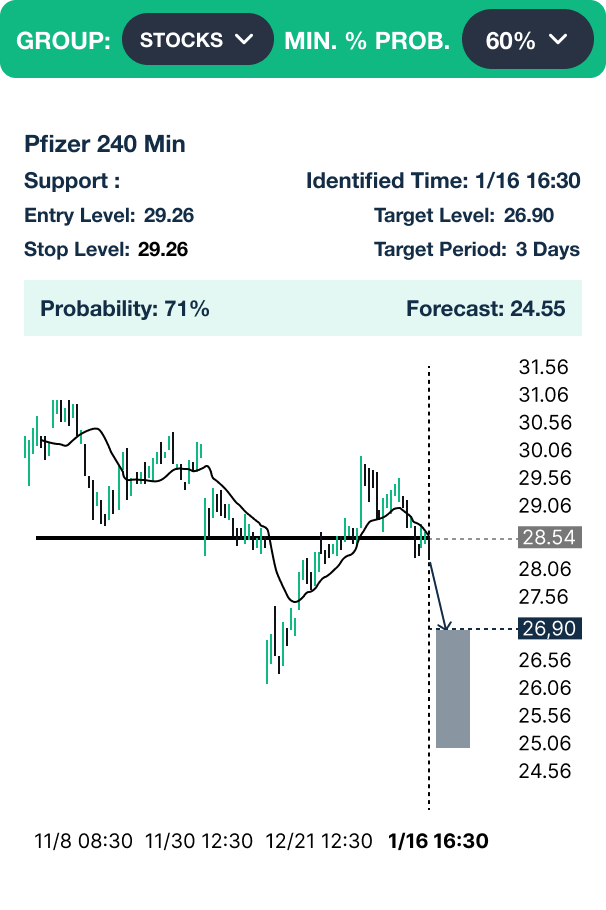
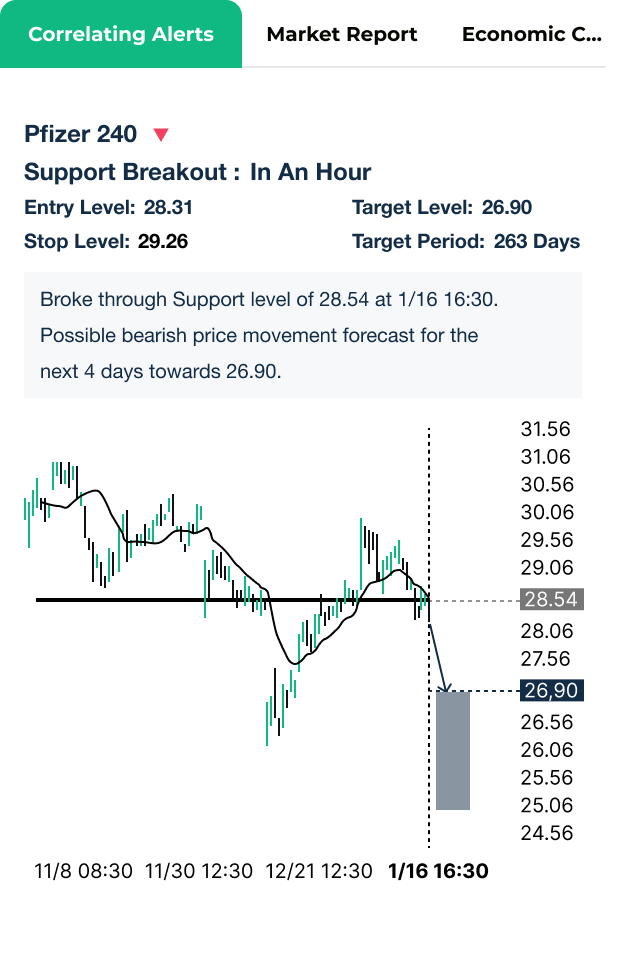
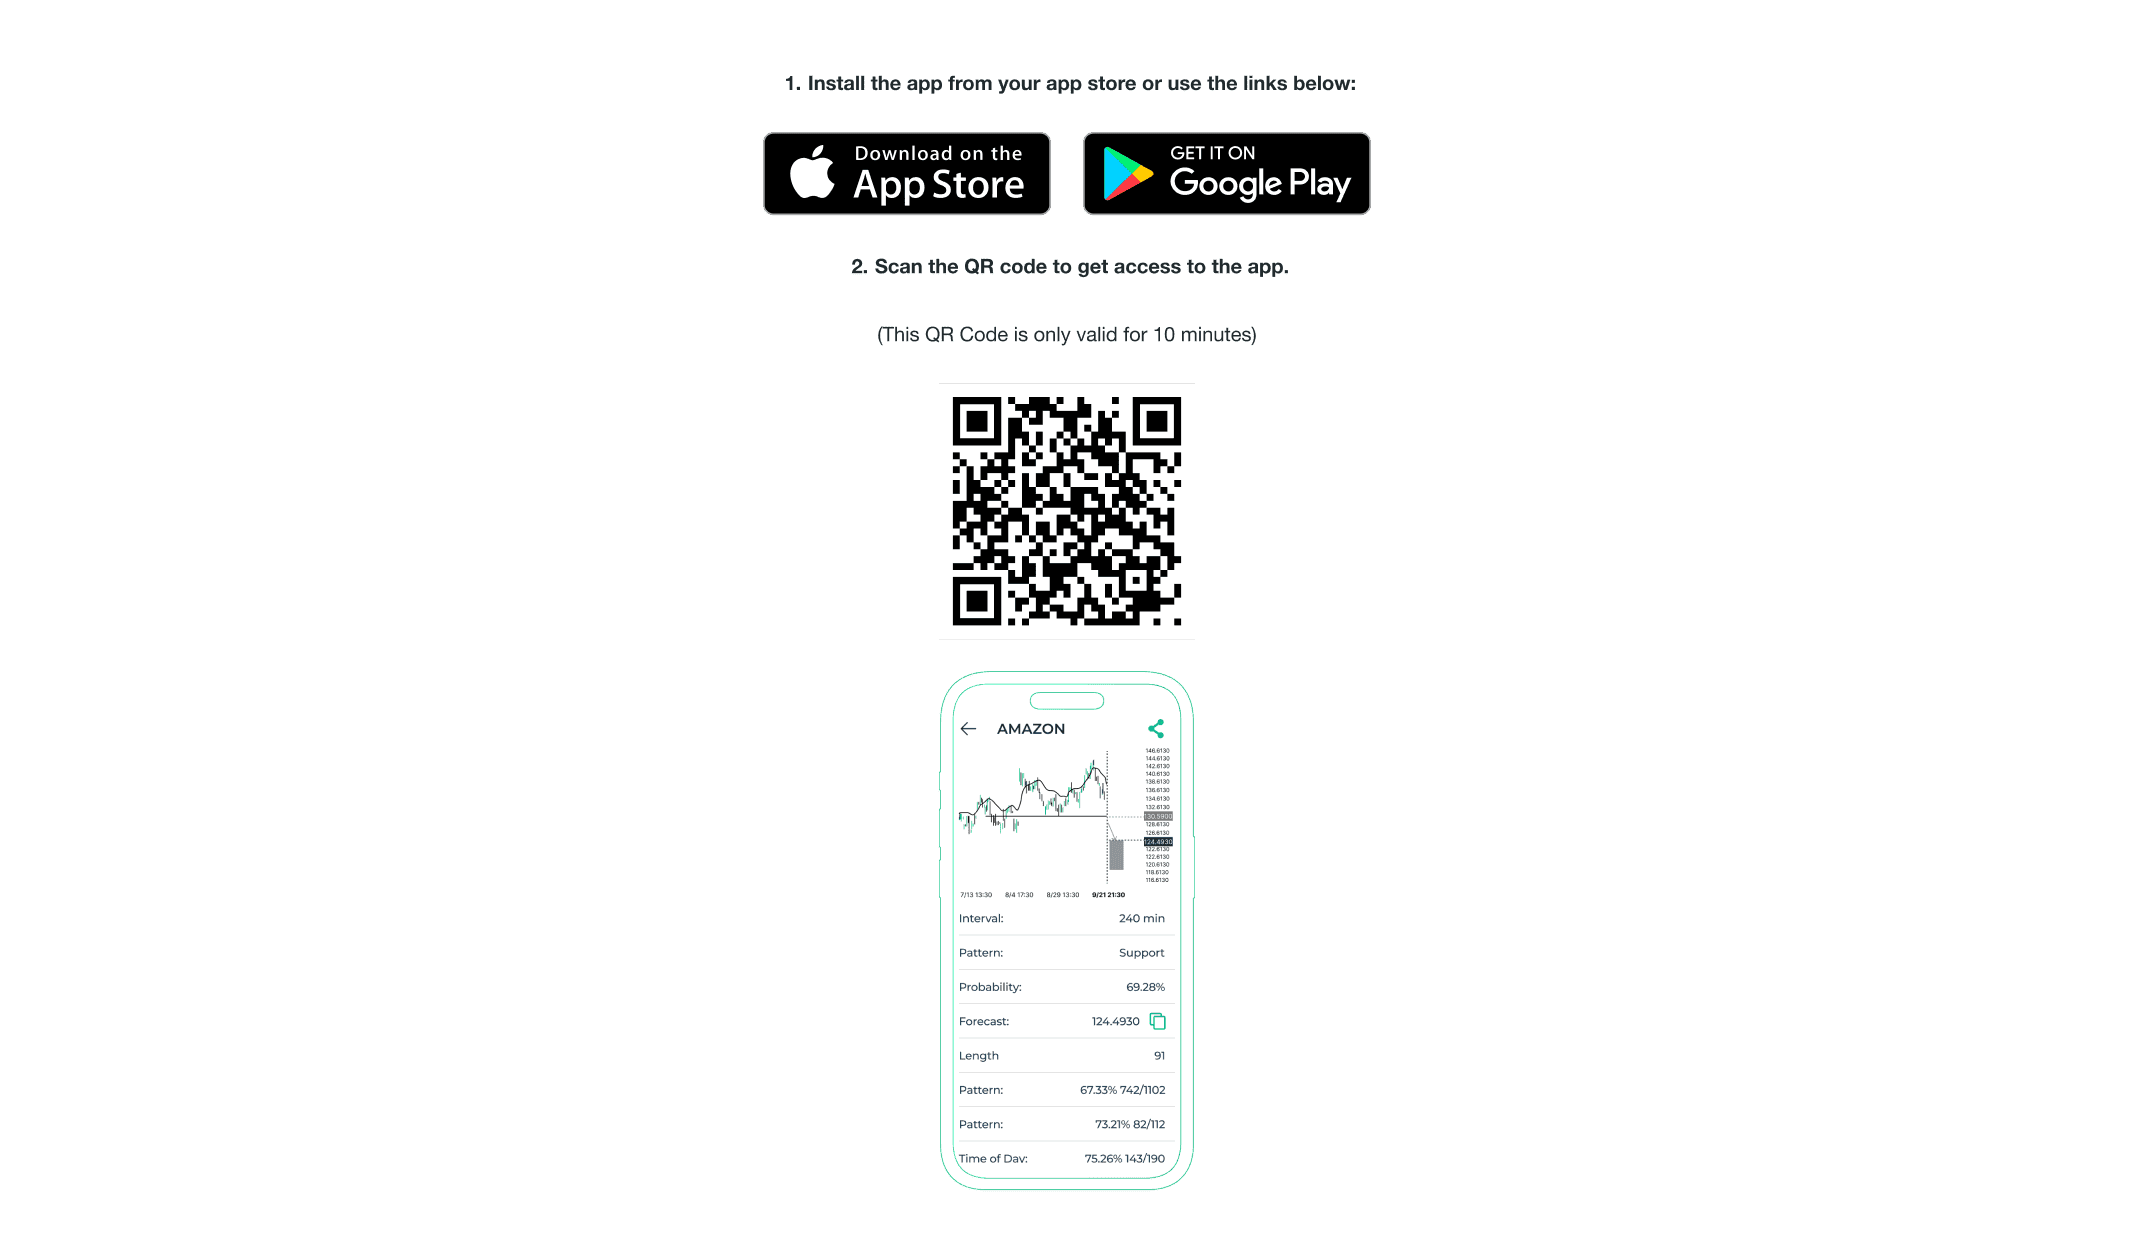
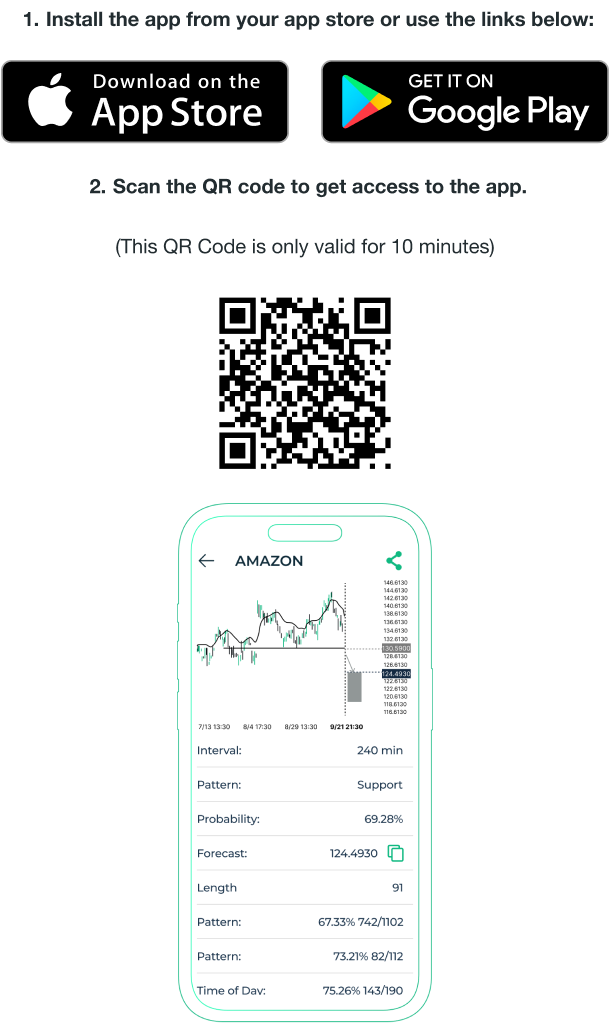
The Autochartist mobile application allows traders to create a watch list of assets and then view trade setups that have a high probability of hitting the target forecast. Users can receive push notifications for these setups to track their favourite assets. Past performance is no guarantee of future results. The application is not a trading platform nor a trading system.
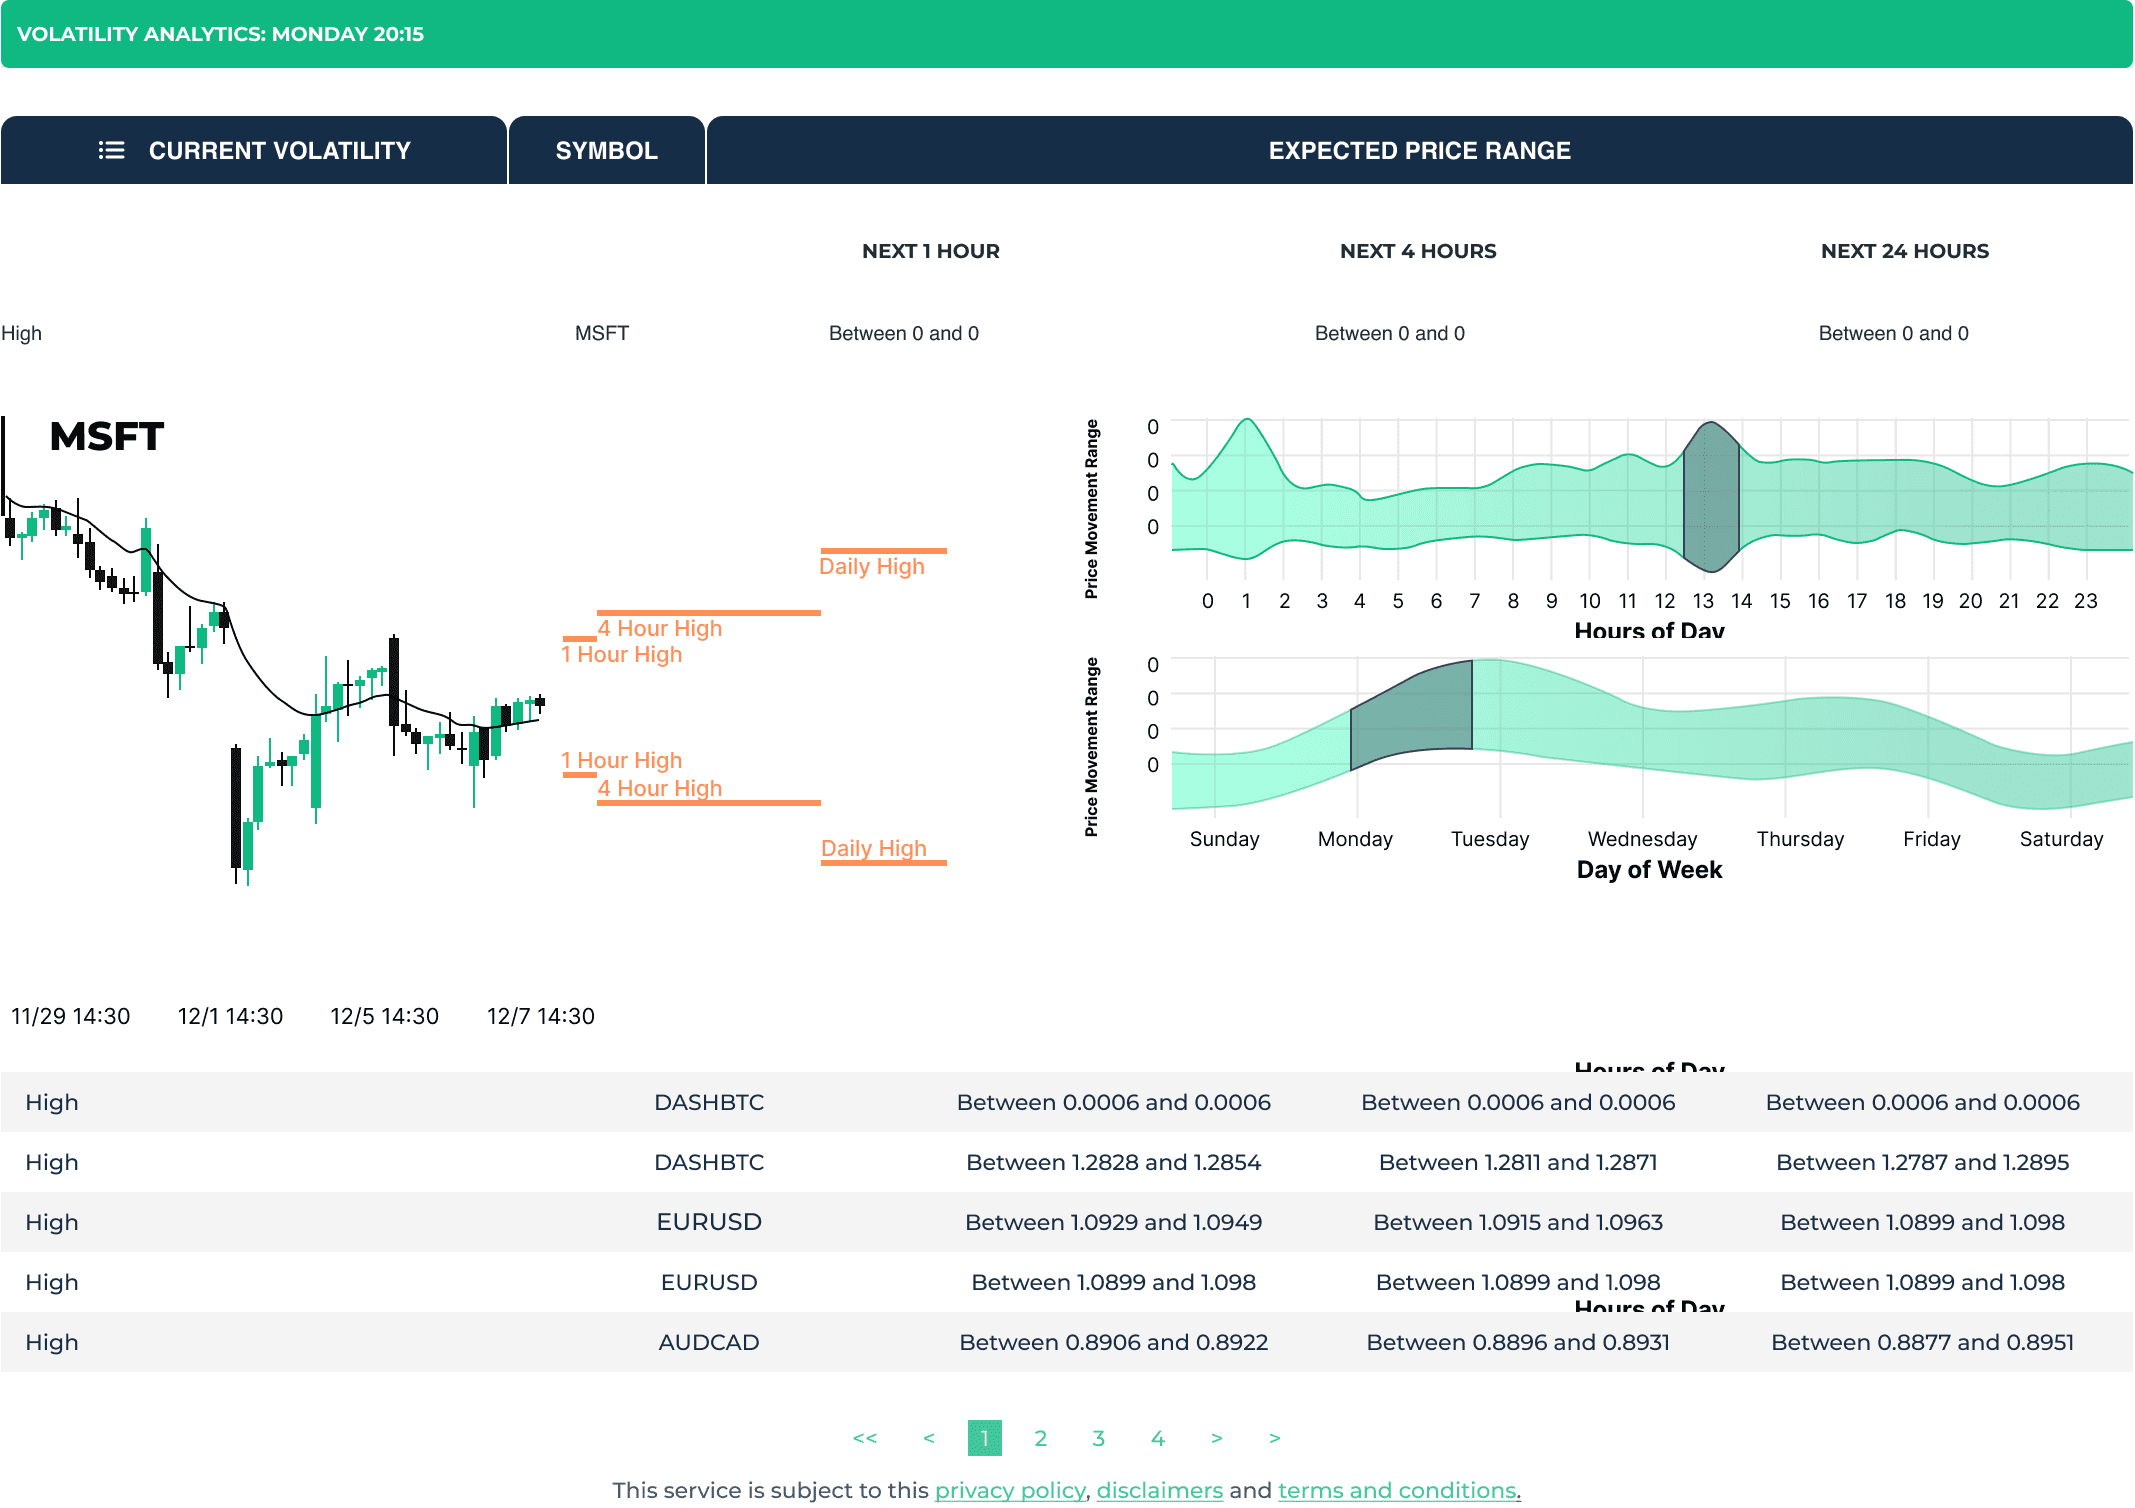
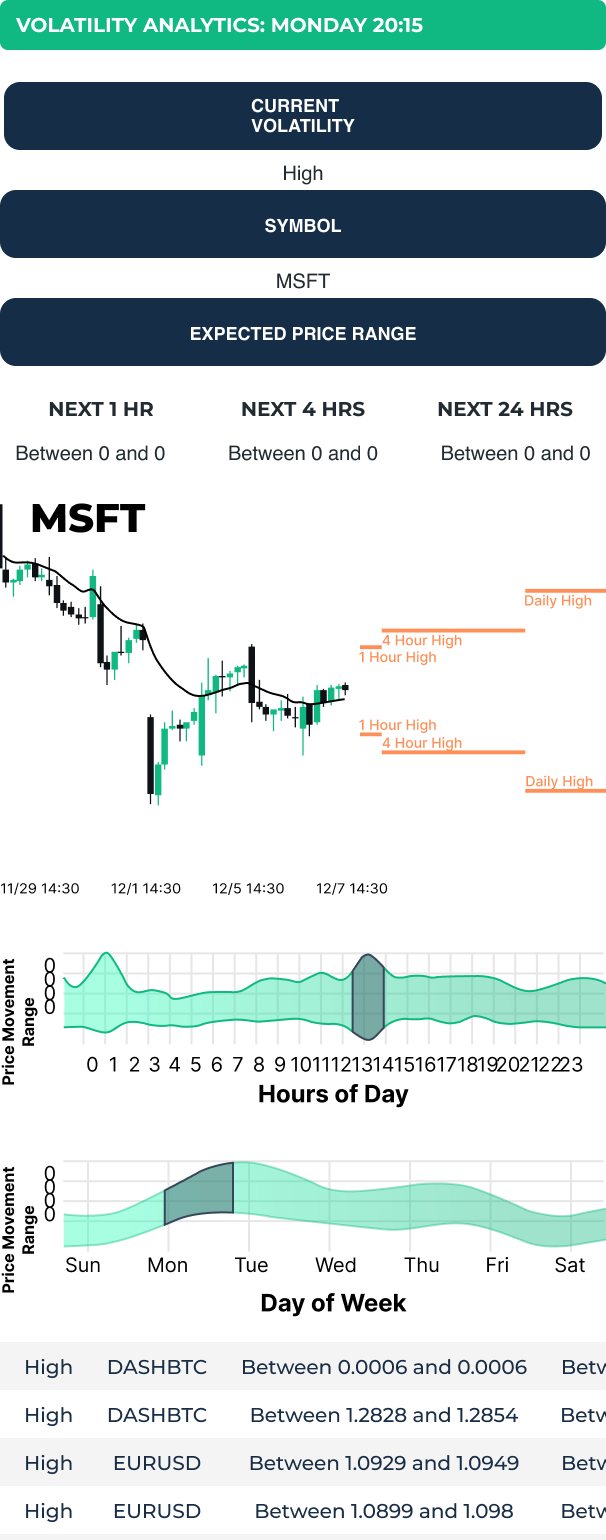
The Volatility Analysis tool provides a comprehensive view of the expected price range movement of the selected instrument. Autochartist measures and presents this information in 3 time formats; by day of the week, the hour of the day, and real-time ranges. You can use this information to decide which Instrument to trade for a specific time of day and set market appropriate exit levels.
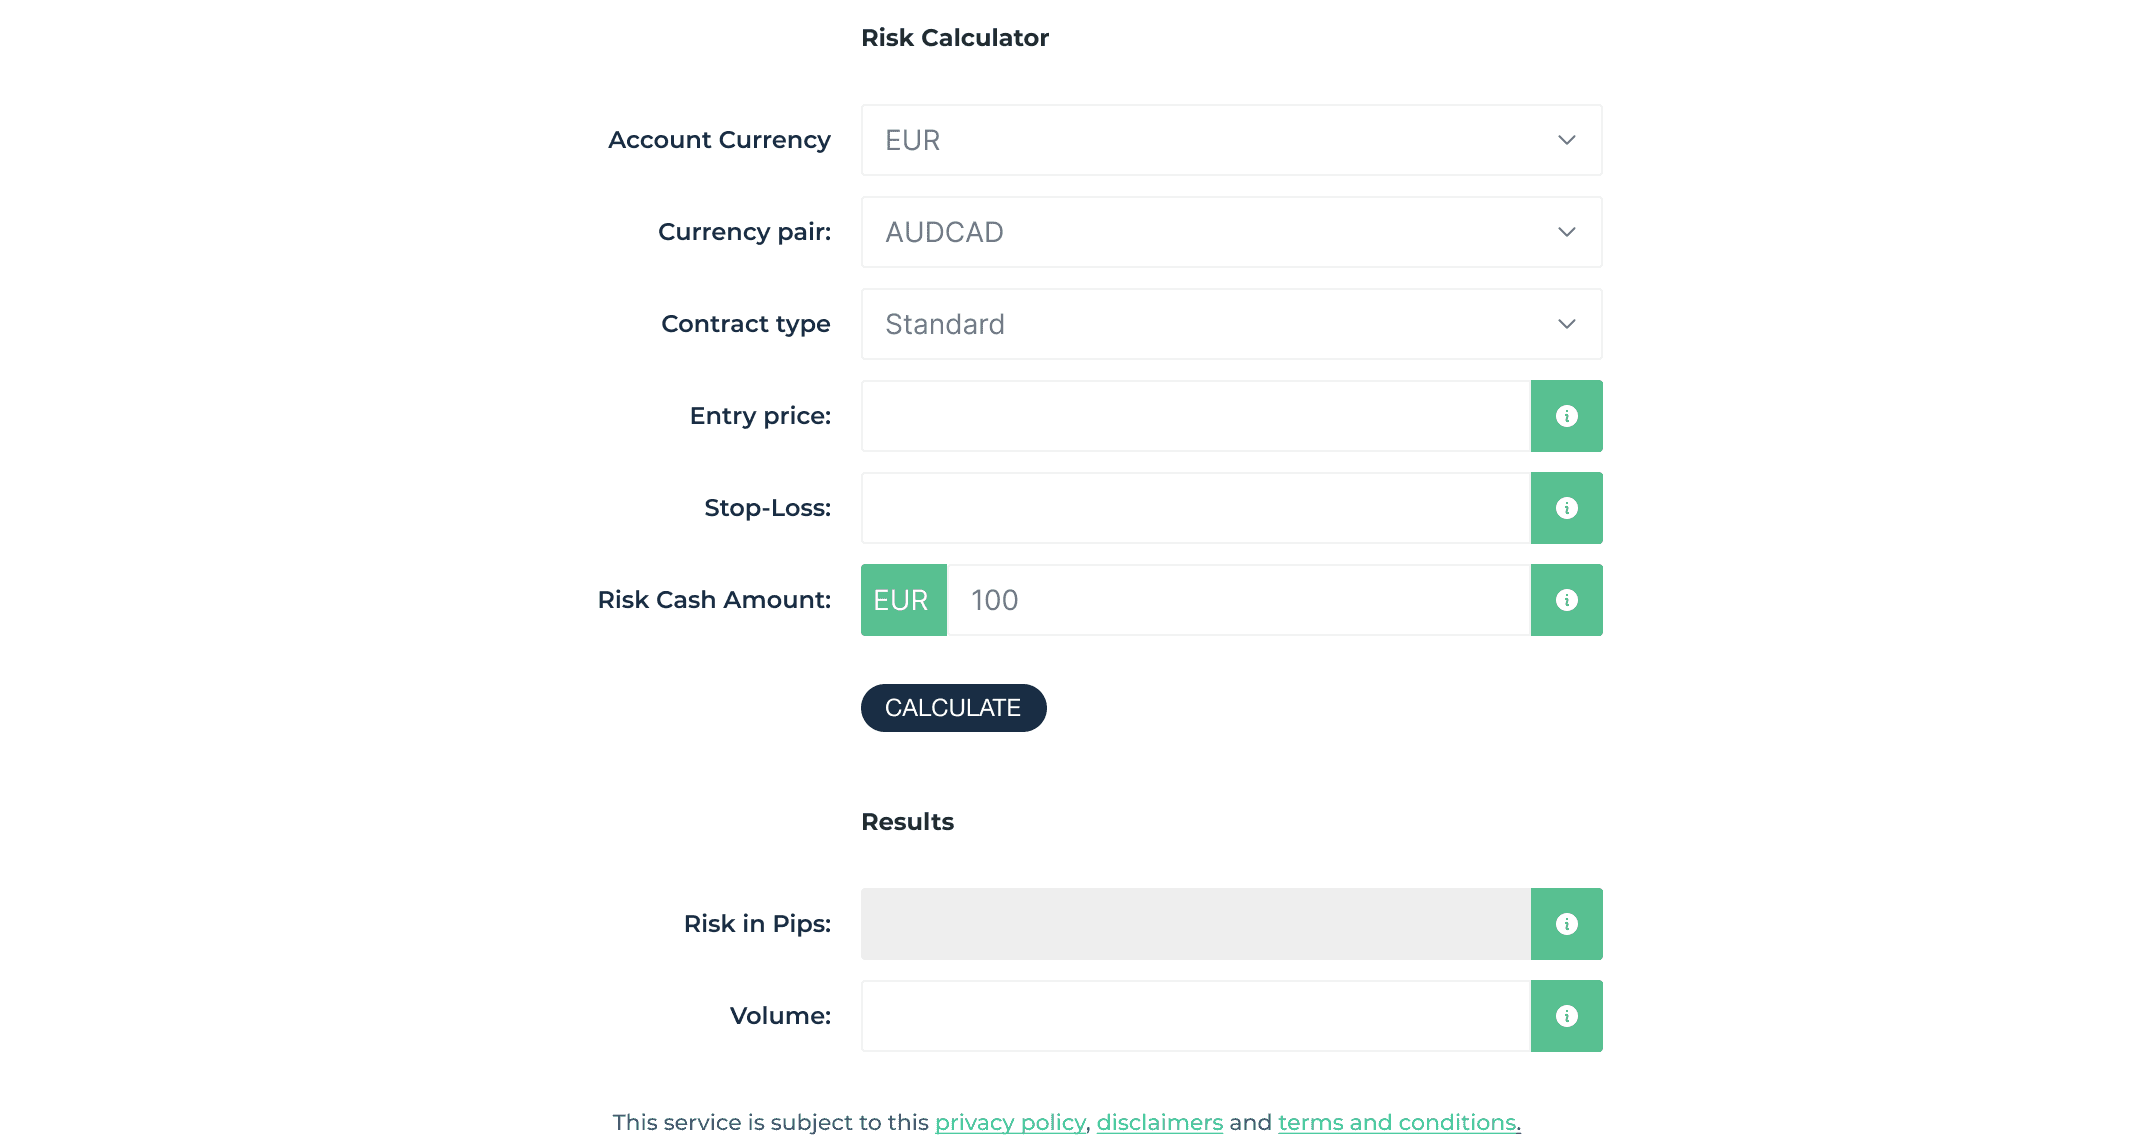
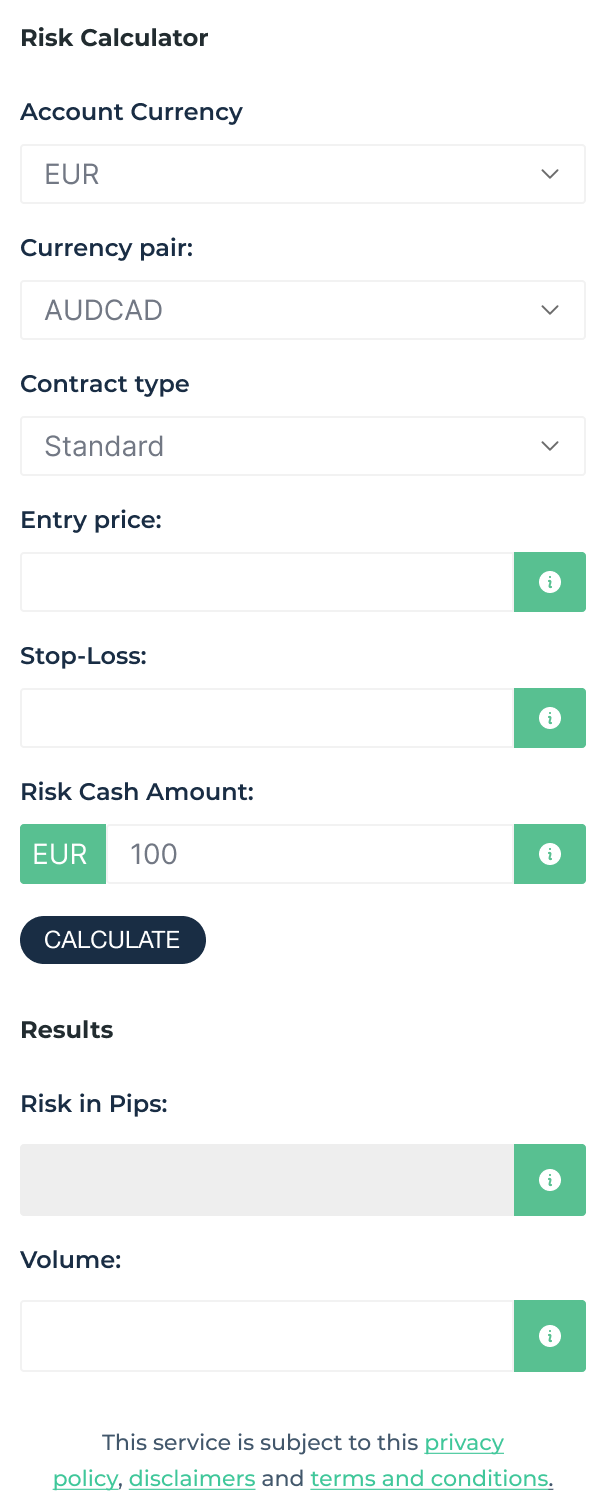
The Risk Calculator tool assists traders in setting appropriate position sizes based on stop-loss levels and risk tolerance. This tool is used to manage over-exposure that may result in significant losses.
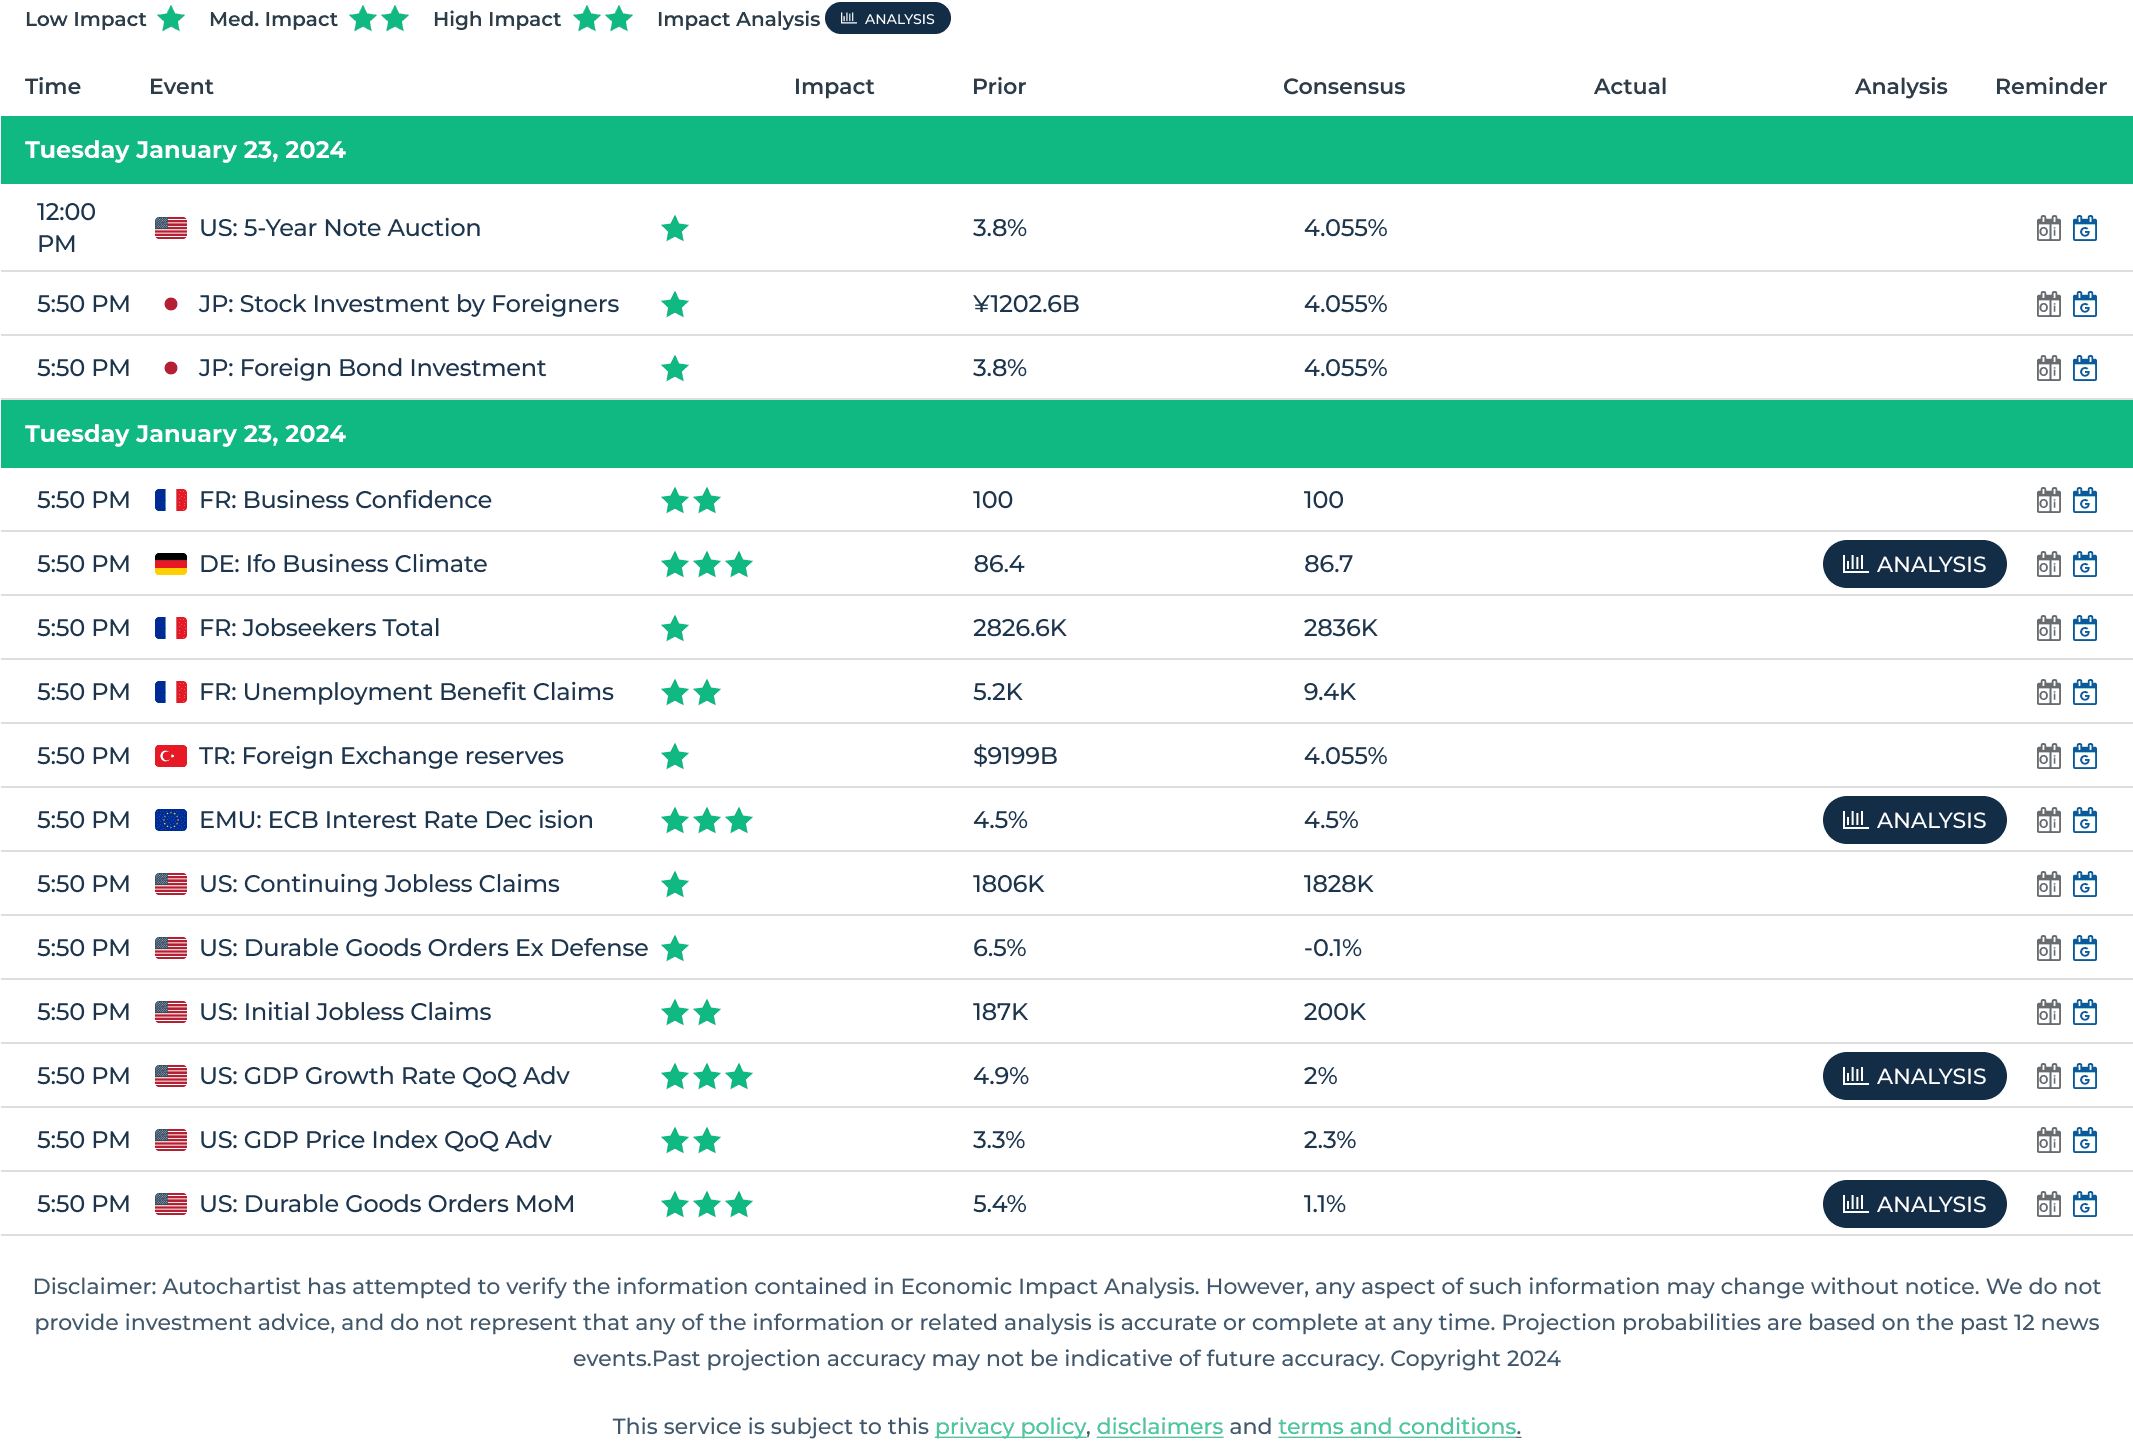
The Economic Event Analysis service provides traders with information on how upcoming economic events impact financial markets. Before an economic event, the service offers multiple scenarios based on whether the actual data is above or below the consensus. Once the economic data is released, only the most appropriate scenarios are displayed.
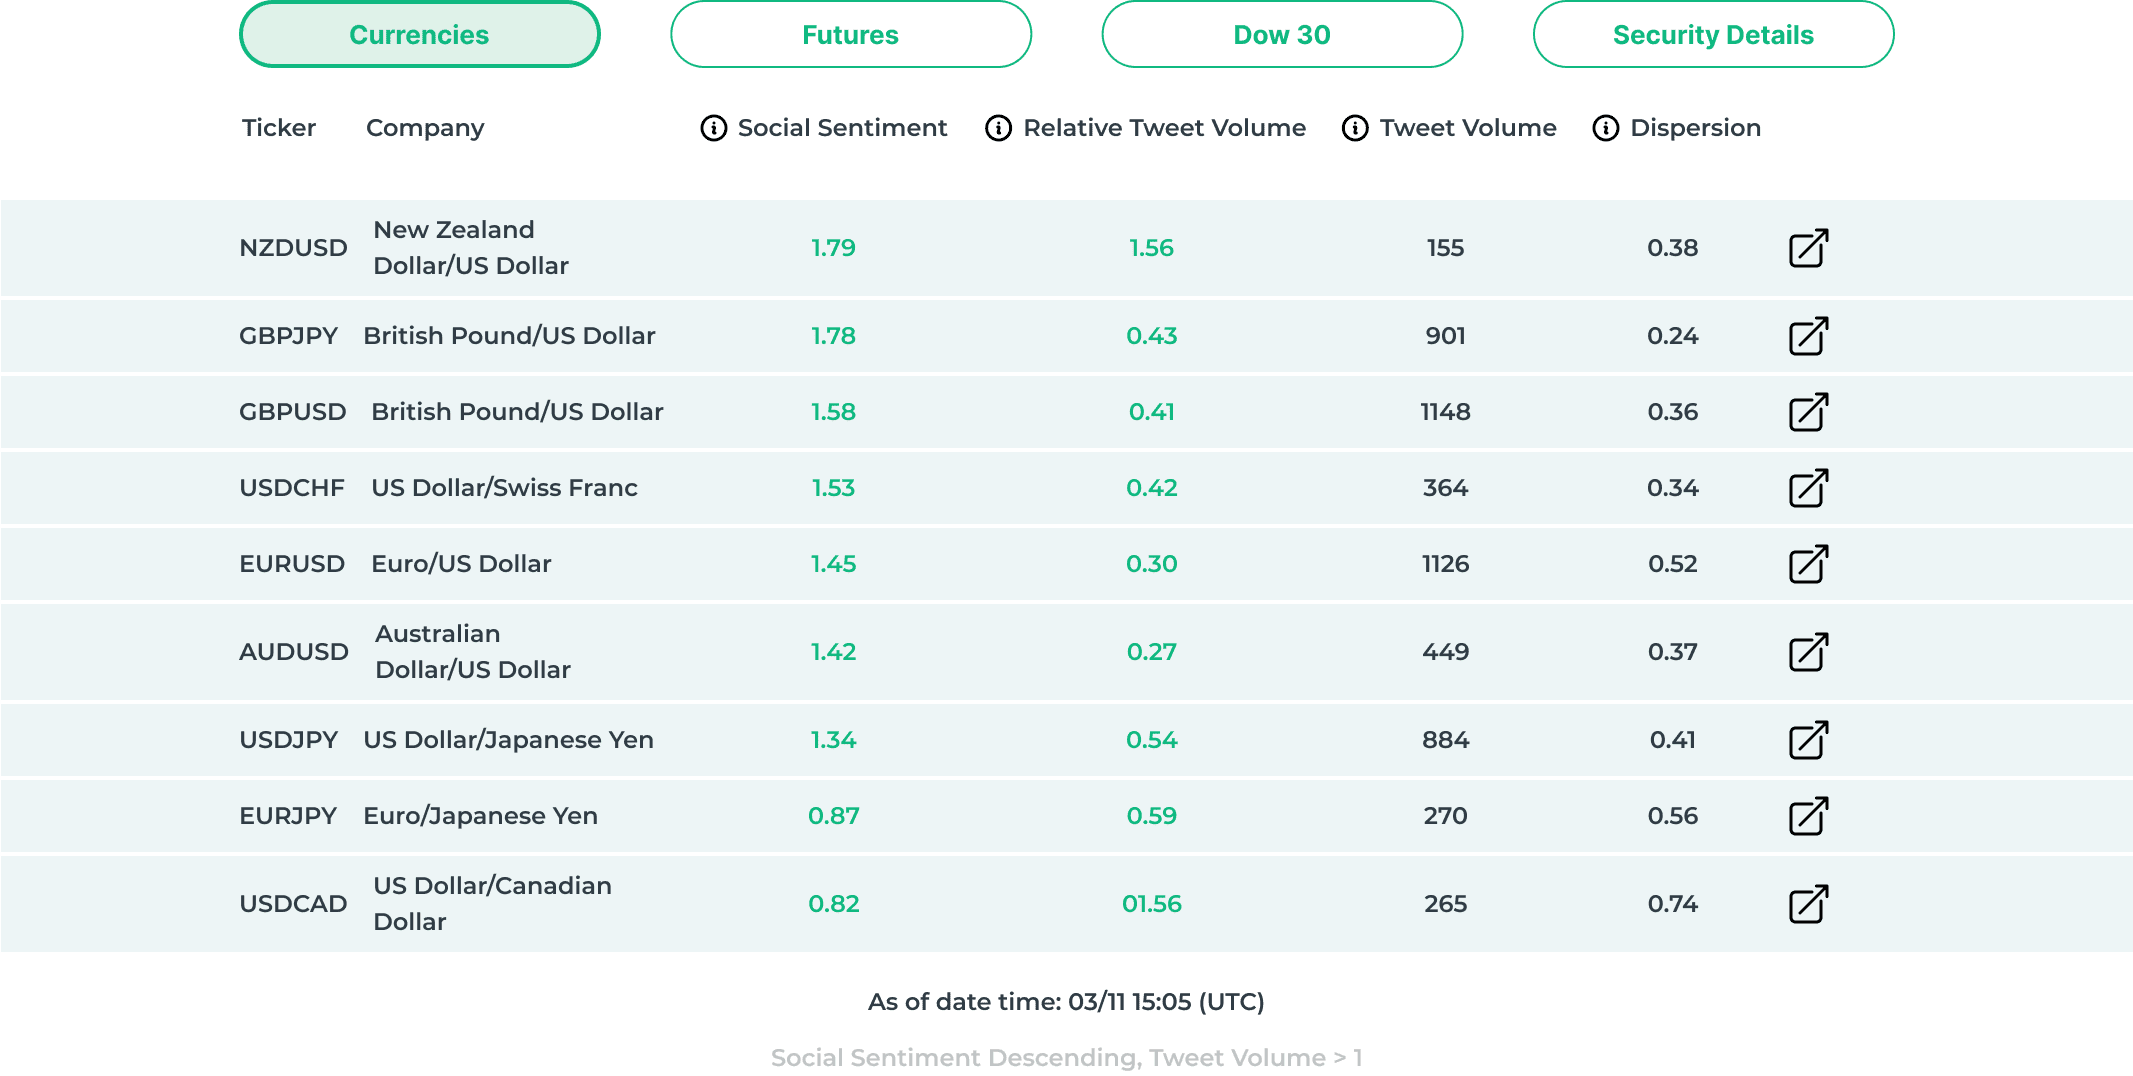
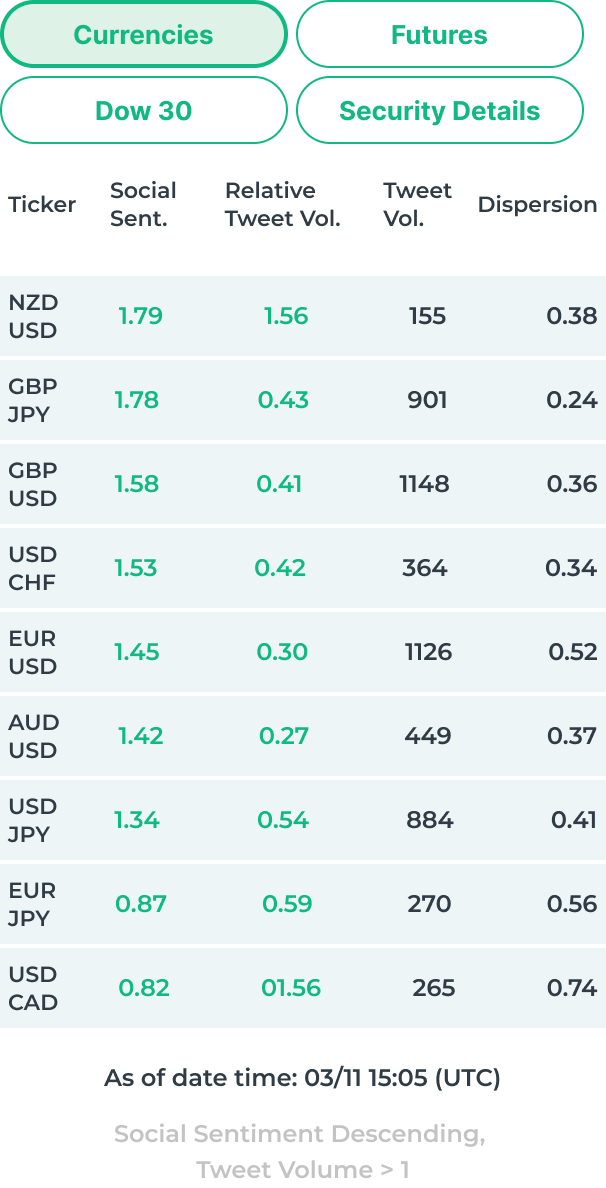
The Social Sentiment tool tracks and analyzes social media sentiment to provide valuable insights into perceived market trends and public perception of major currency pairs, futures contracts, and stocks.
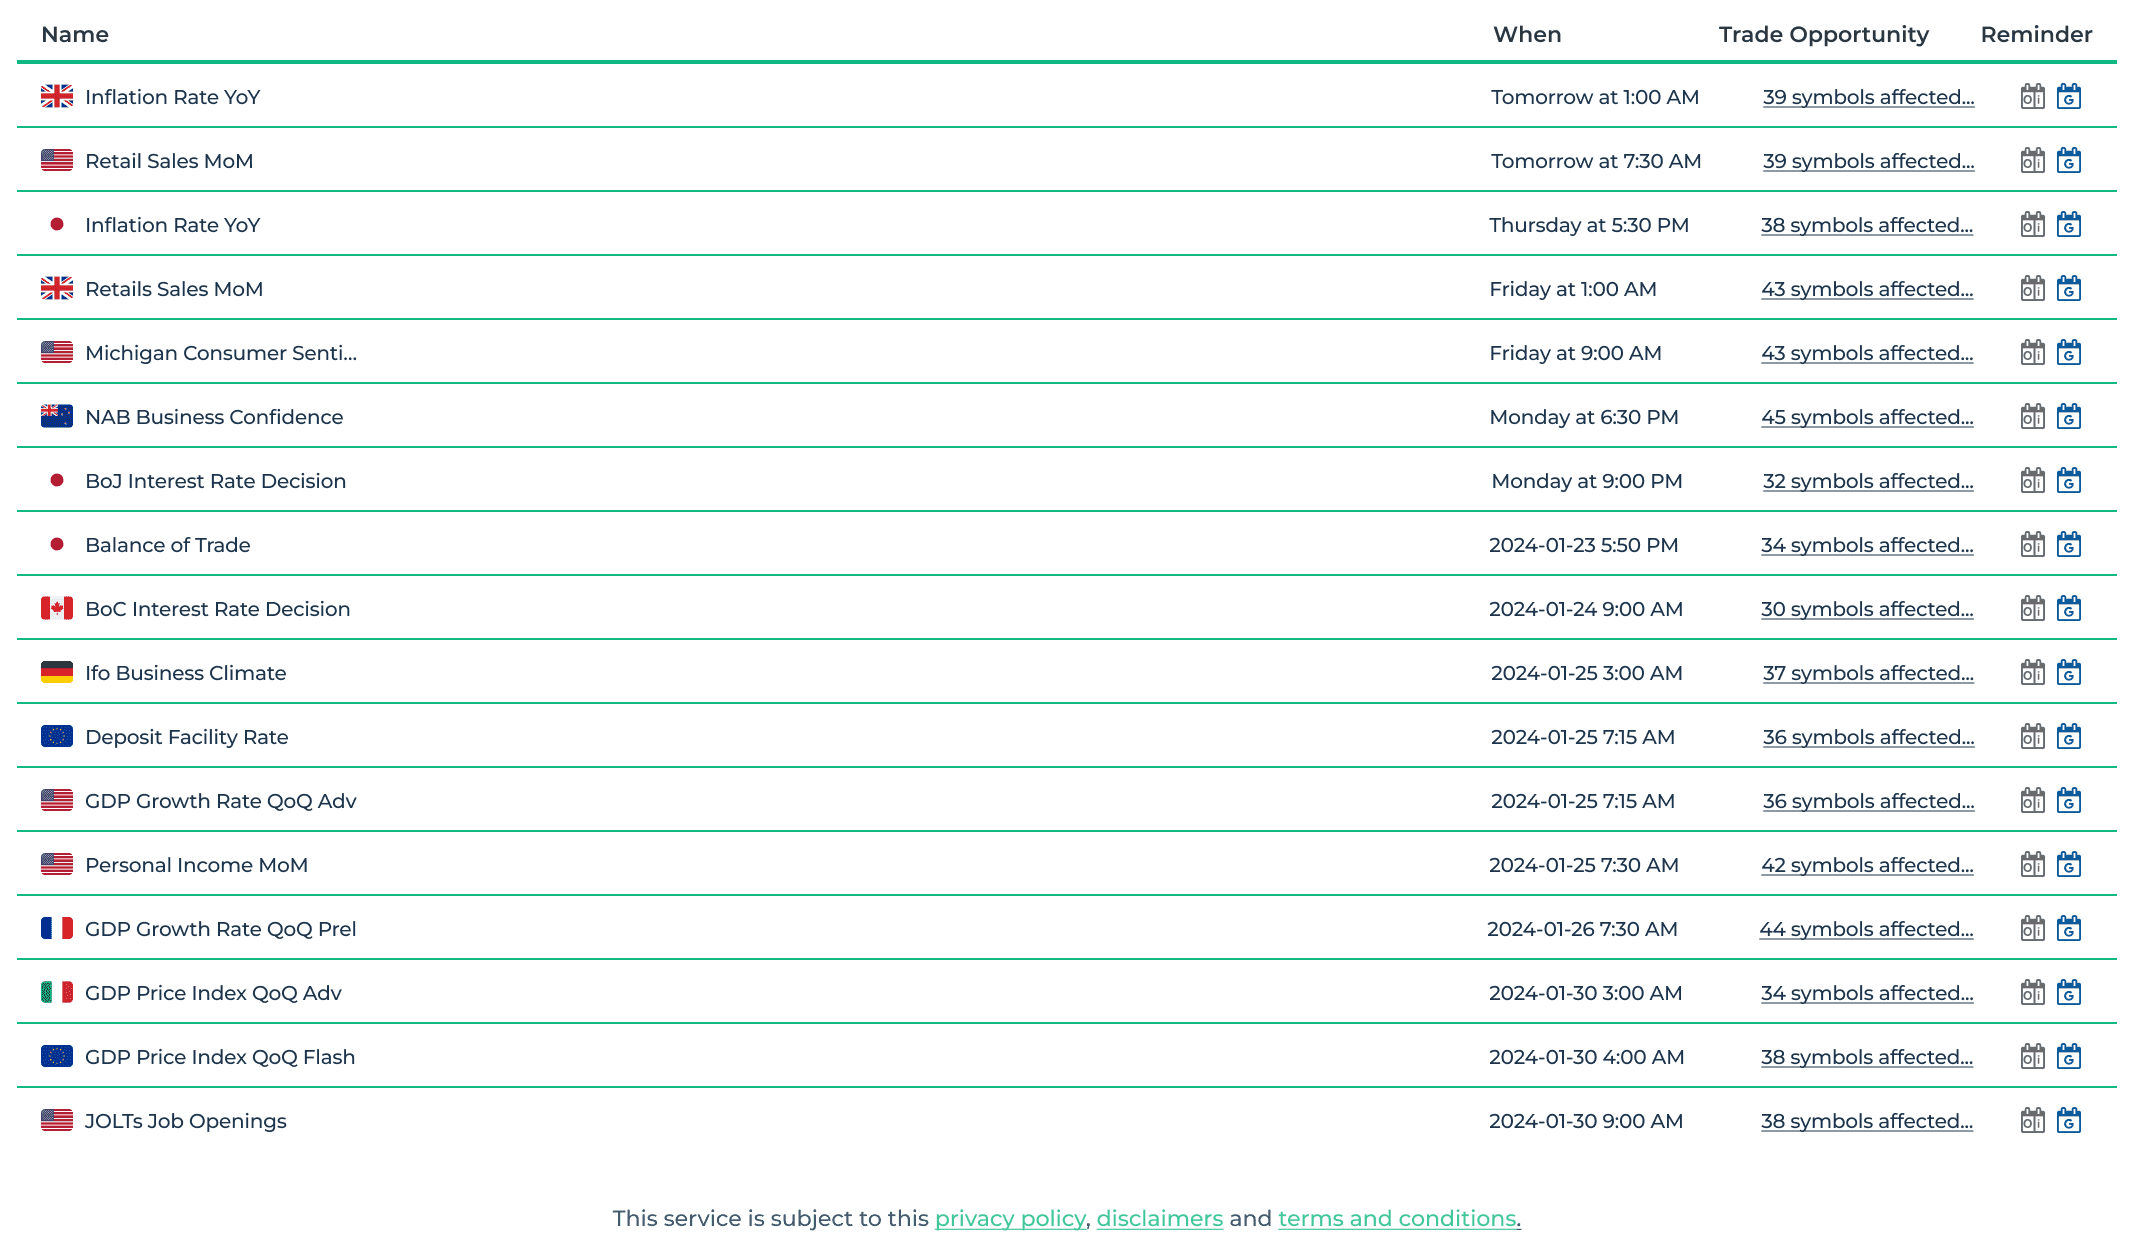
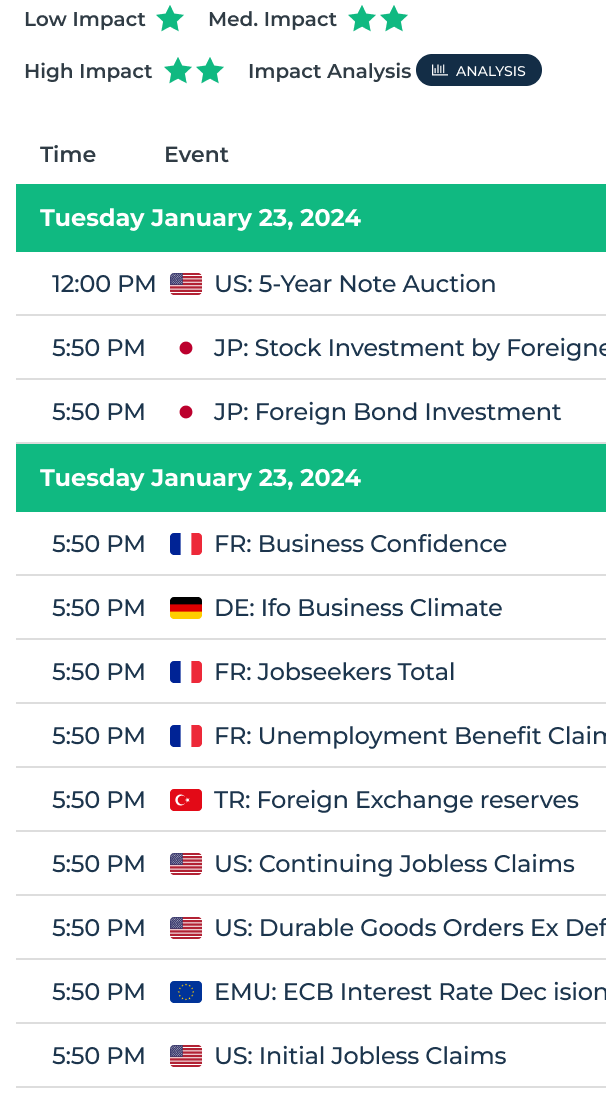
The Calendar enables traders to assess the importance of particular events. On high-impact events, traders can view a detailed analysis where they can select their preferred currency and view historical data of the market consensus, potential movements, and directional trends for the chosen currency.
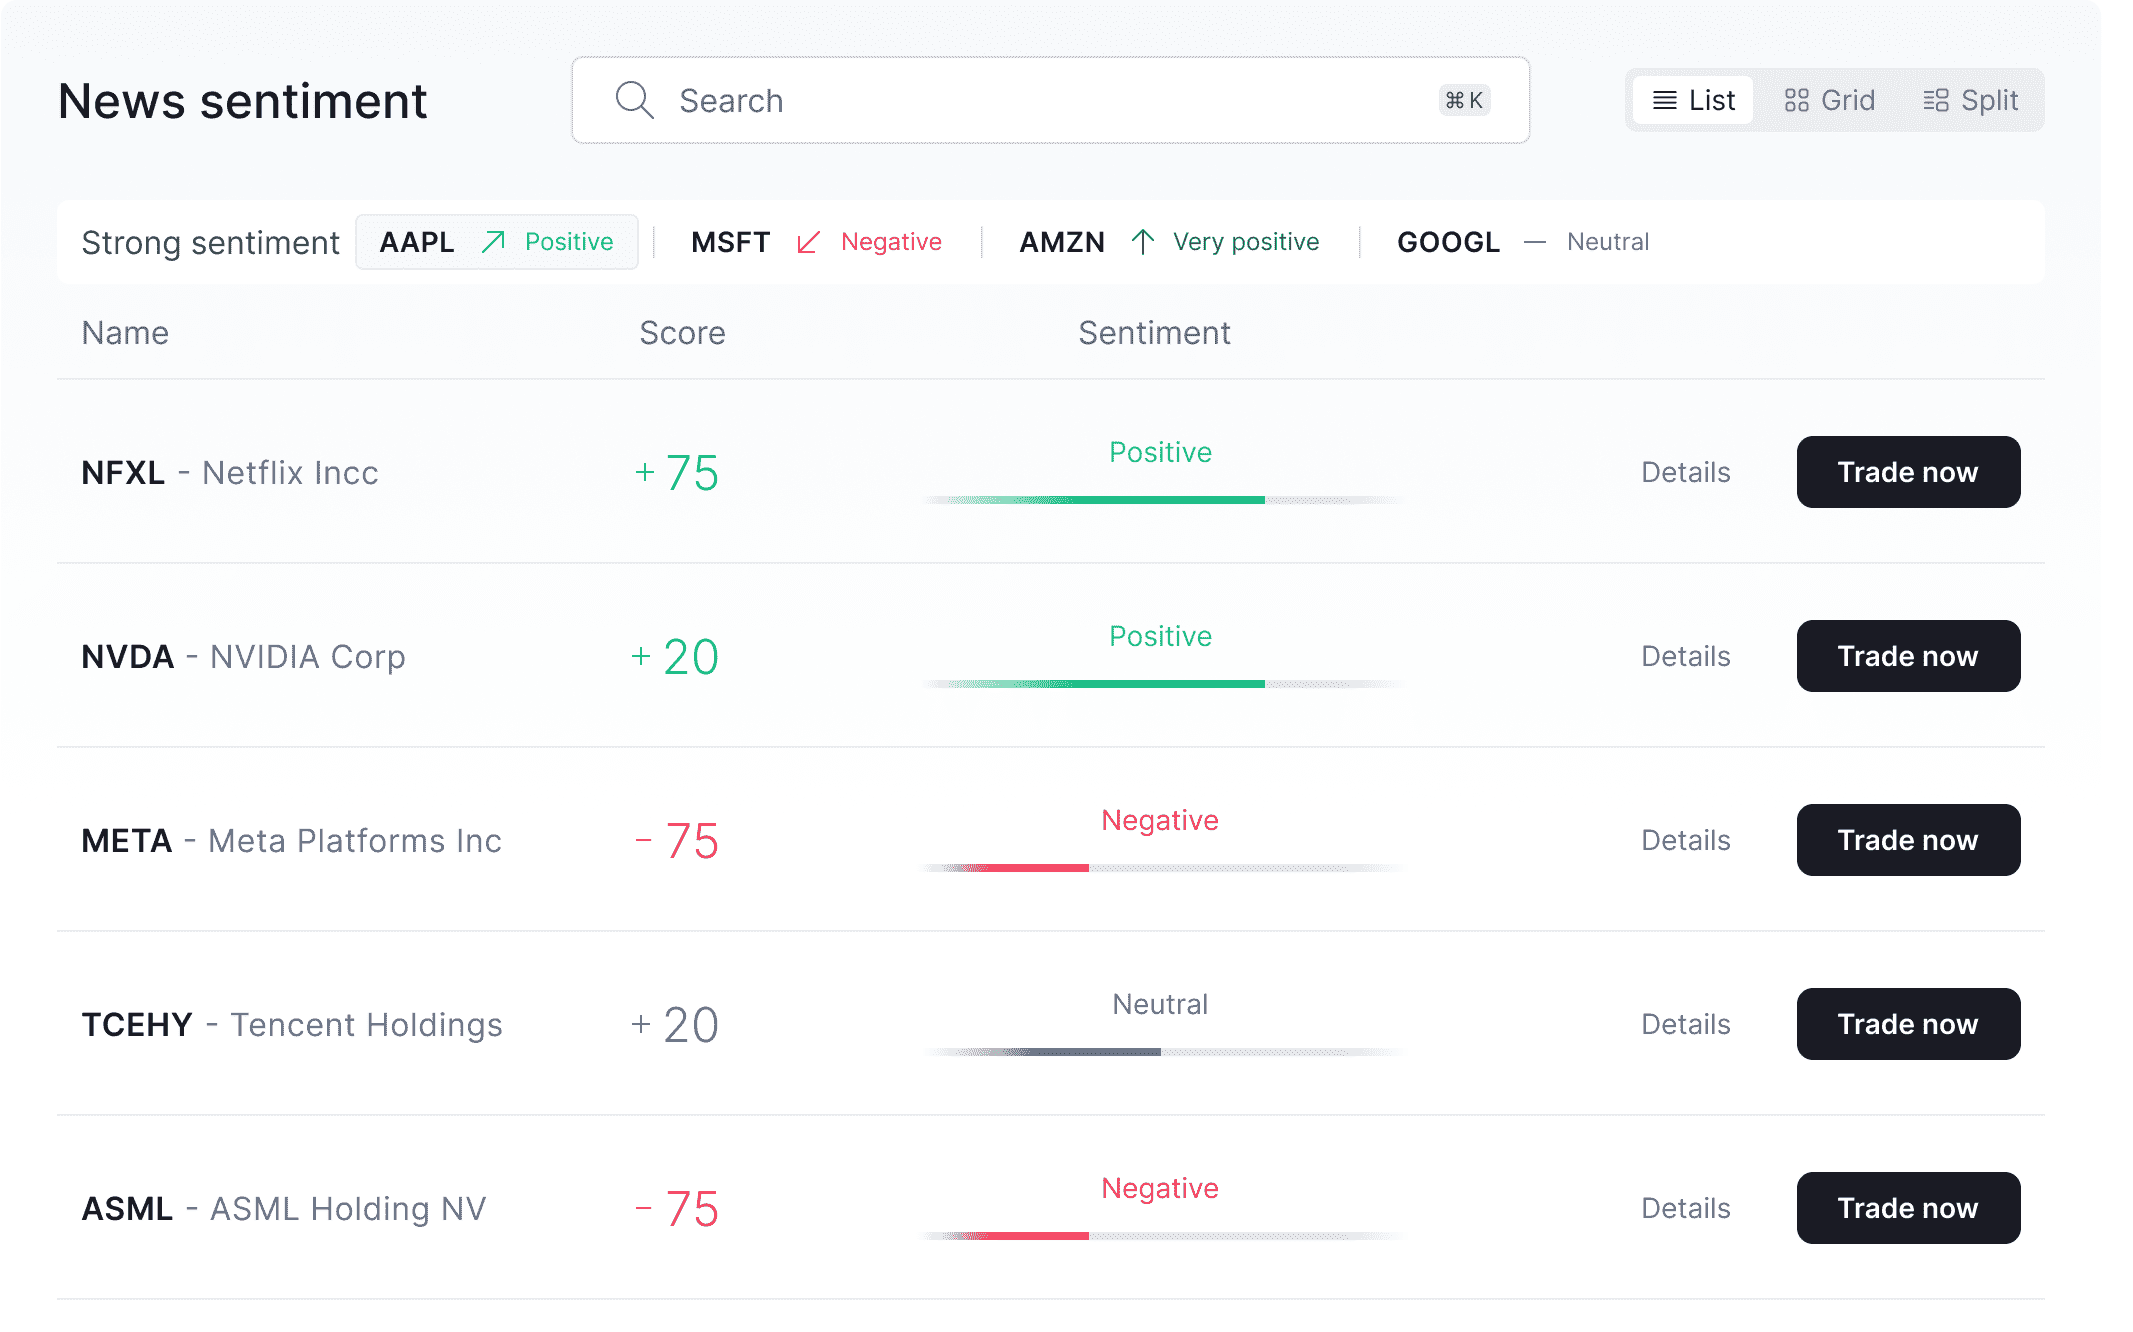
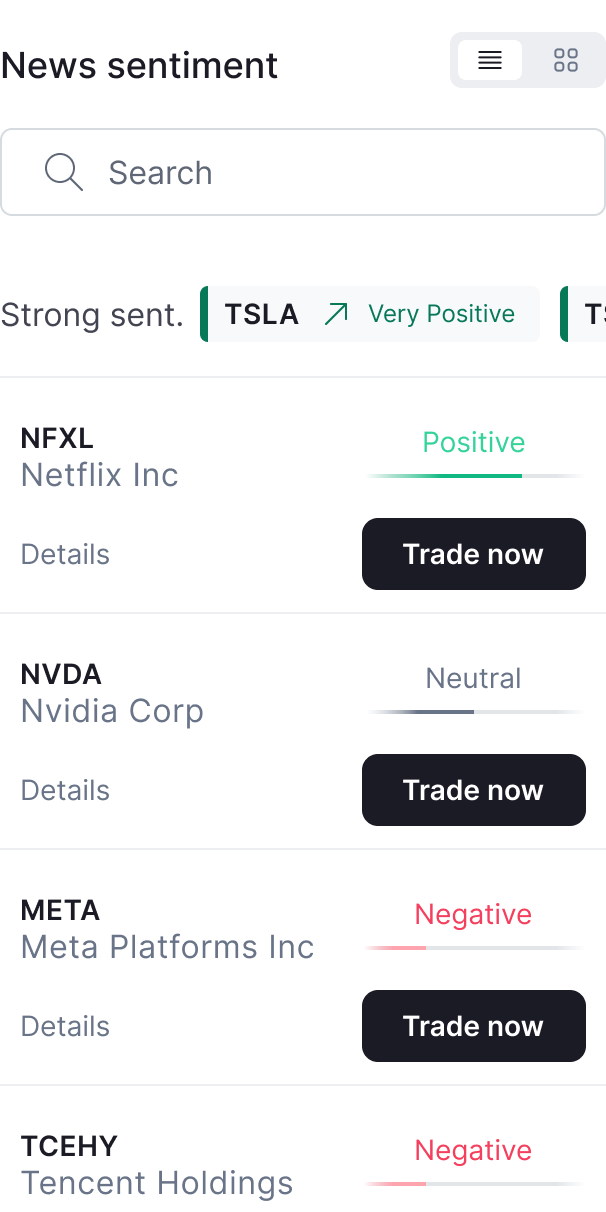
This easy-to-use tool analyses and aggregates the top financial news and media sources to offer a visual sentiment score for major currencies and US stocks. Simplifying market news complexity and presenting sentiment trends over various time frames.
The statistics below summarize how often Autochartist’s forecasts reached their target levels. The stats are based on the last 12 months of analysis and are updated weekly. These statistics are independent of any stop-loss strategies and should be used only as an indication of trade-setup tendencies rather than as a complete trading system. Disclaimer: Past performance may not be indicative of future performance.
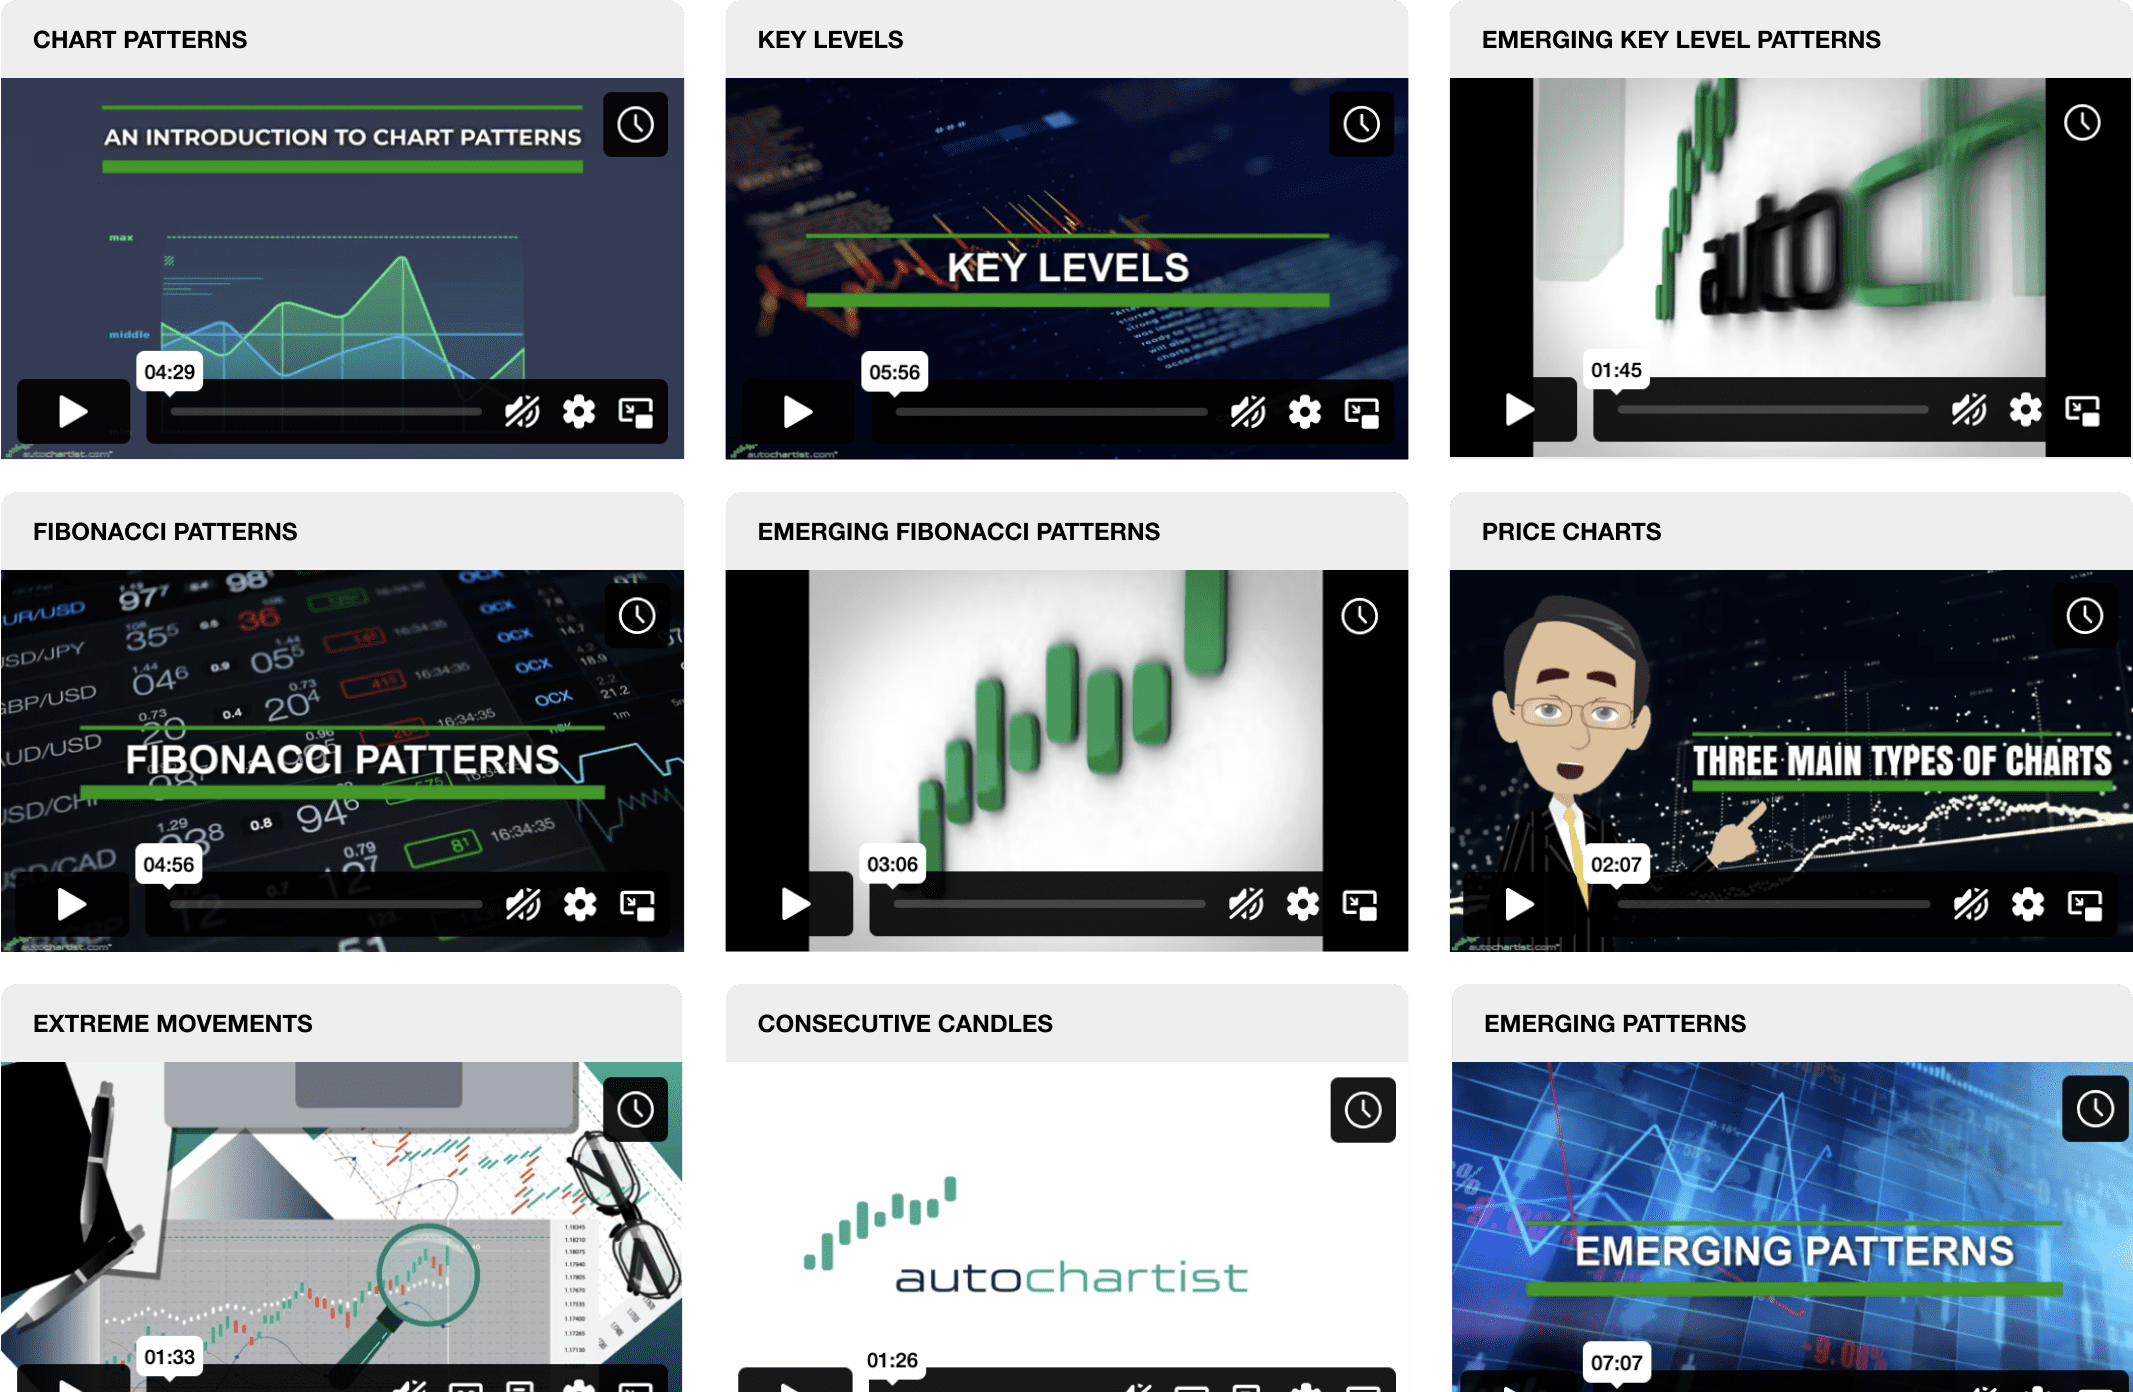
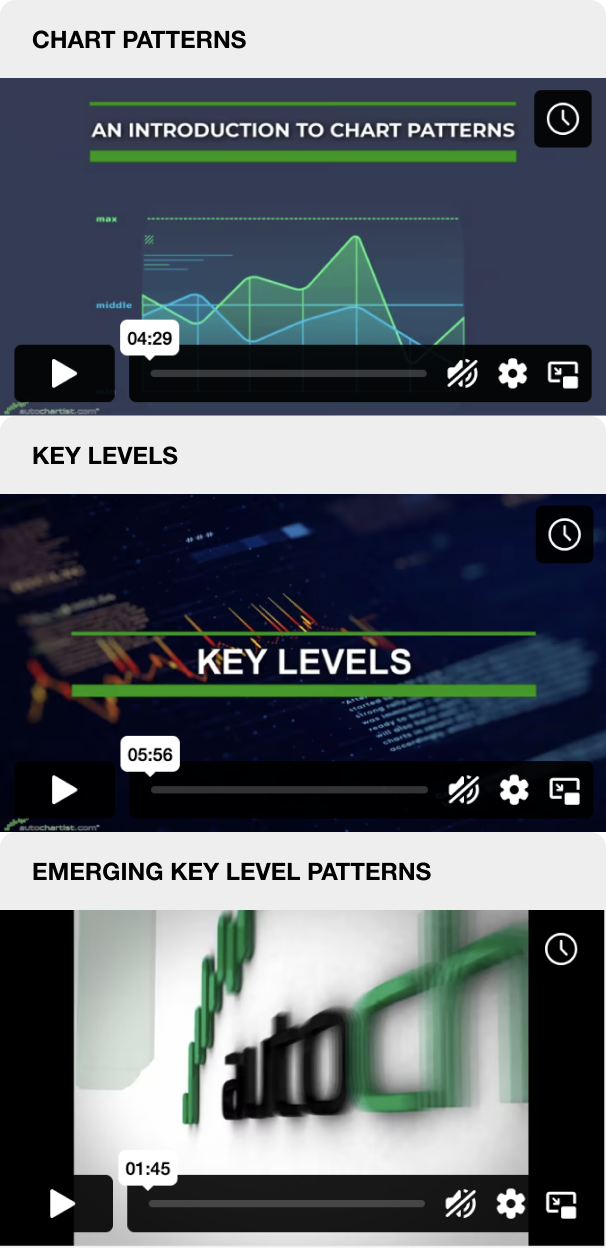
Explore a range of informative videos and tutorials that showcase how Autochartist can help traders make more informed decisions.
Embrace the future of trading with
precision, insight, and confidence.
Enjoy Access to Premium Autochartist Trading Tools Sign Up and Explore for Free Now!